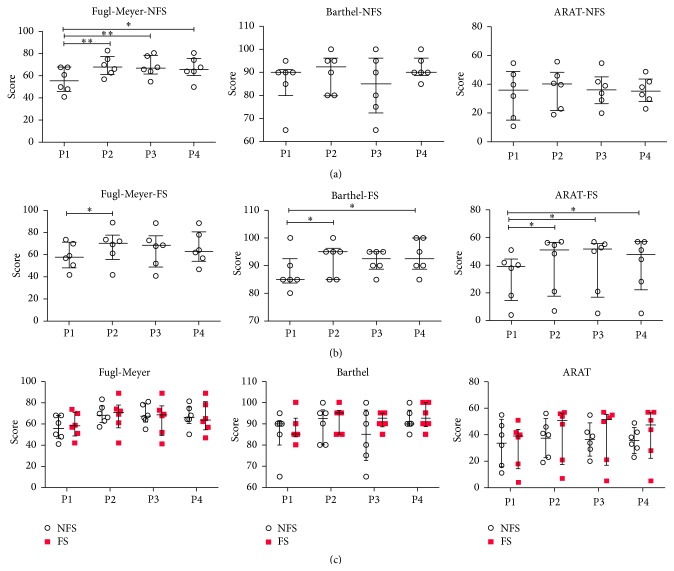
Figure 1.
Results of all clinical scales (Fugl-Meyer, ARAT, and Barthel index), for the NFS and FS groups. Values are represented as median and interquartile interval. ∗ p < 0.05 ∗∗ p < 0.01 based on Tukey post hoc test. (a) shows the results for the clinical scales in the NFS group, before rehabilitation (P1), immediately after rehabilitation (P2), 1 month after the end of rehabilitation (P3), and three months after the end of rehabilitation (P4). (b) shows the results of clinical scales in the FS group. (c) shows the between-group comparison (NFS × FS) at the different periods of evaluation (P1, P2, P3, and P4).

