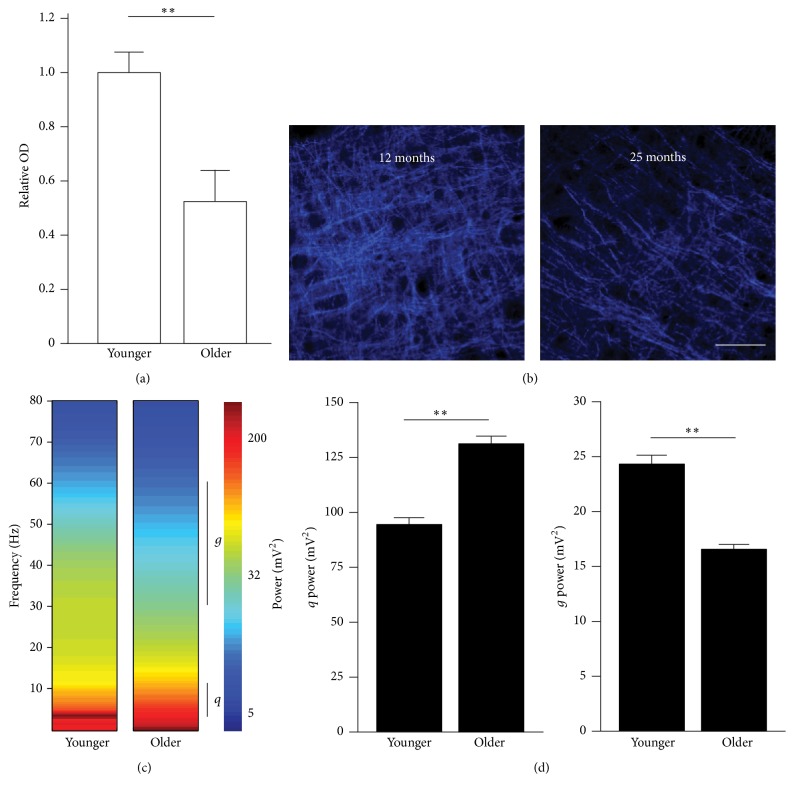
Figure 1.
Reduction in Choline Acetyl Transferase (ChAT) and gamma activity in the older A1. (a) Average density of ChAT staining in young and older A1 determined by immunohistofluorescence (primary Ab: anti-ChAT; secondary Ab: AF647). (b) High power (40x) photomicrograph showing staining for ChAT in layer 4 of A1 in one younger (12-month-old) and one older (25-month-old) rat. (c) Power spectral density of local field potential (LFP) signals recorded during the presentation of tone pips in younger and older rats. The theta (θ) and gamma (γ) range is shown by vertical black bars. (d) Average theta (left) and gamma (right) band power in the LFP signals recorded in younger and older A1 during pure tone presentation. Note the relative increase in theta and decrease in gamma consistent with loss in cholinergic tone in A1 (younger: n = 6, recorded sites for LFP = 586, hemispheres examined for ChAT staining, n = 8, and number of photomicrographs analyzed, n = 24; older: n = 5, recorded sites for LFP = 476, hemispheres examined for ChAT staining, n = 8, and number of photomicrographs analyzed, n = 24). Scale bar: 50 μm. Values shown are mean ± SE. ∗ p < 0.05: ∗∗ p < 0.01: t-test.

