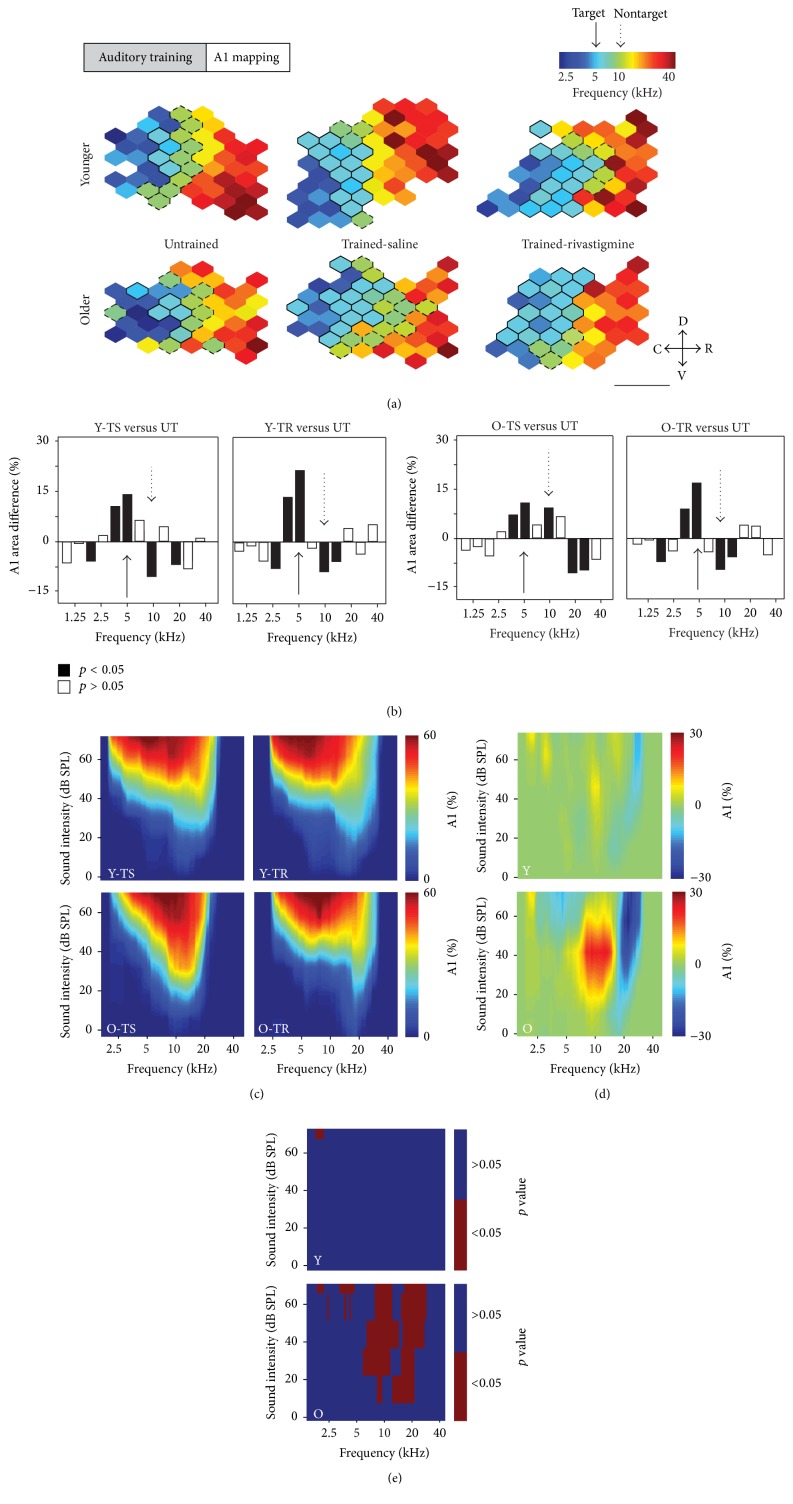
Figure 3.
Impact of training and rivastigmine on A1 frequency tuning. (a) Representative A1 characteristic frequency (CF) maps from naïve (untrained), trained with saline (TS), and trained with rivastigmine (TR) young and older rats. Bolded polygons have a CF at the target tone ±0.3 octaves. Hatched polygons have a CF at the nontarget tone ±0.3 octaves. Note the increase in map area to the nontarget tone in the O-TS group only. (b) Difference in A1 area tuned to various frequencies between each experimental group and untrained animals. The full arrow points to the target frequency; the hatched arrow points to the nontarget frequency. Note how in each group except O-TS there is a significant reduction in area tuned to the nontarget frequency. (c) Percentage of A1 activated by every frequency-intensity combination used for mapping in all experimental groups. (d) Difference in the percent of activation between Y-TS and Y-TR (top) and O-TS and O-TR (bottom). (e) Plot showing statistically significant difference in A1 activation in the young (top) and older (bottom) groups. Scale bar represents 1 mm. D: dorsal; C: caudal; R: rostral; V: ventral (Y-UT: n = 8, recorded sites = 435; Y-TS: n = 5, recorded sites = 257; Y-TR: n = 6, recorded sites = 312; O-UT: n = 8, recorded sites = 412; O-TS: n = 5, recorded sites = 261; O-TR: n = 5, recorded sites = 249). Values shown are mean ± SE. ∗ p < 0.05: t-test.

