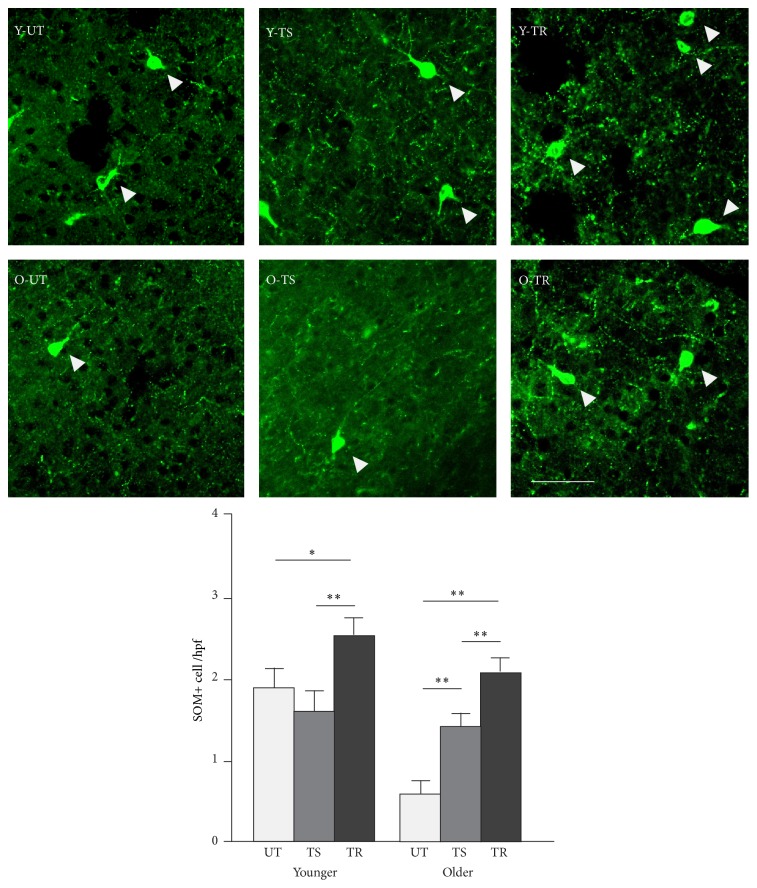
Figure 6.
Effect of training and rivastigmine on the number of SOM+ cortical interneurons. Quantitative analysis of the average number in A1 of SOM immunoreactive cells per high power field (hpf) in all experimental groups. Top panel: representative high power photomicrographs of representative sections in all groups. Bottom panel: average SOM+ cell counts in all groups (all layers pooled). Number of hemispheres examined: Y-UT = 10, Y-TR = 8; O-UT = 8, O-TR = 8; number of micrographs/hemispheres: 7. ∗ p < 0.05, ∗∗ p < 0.01, t-test. Scale bar: 50 μm.

