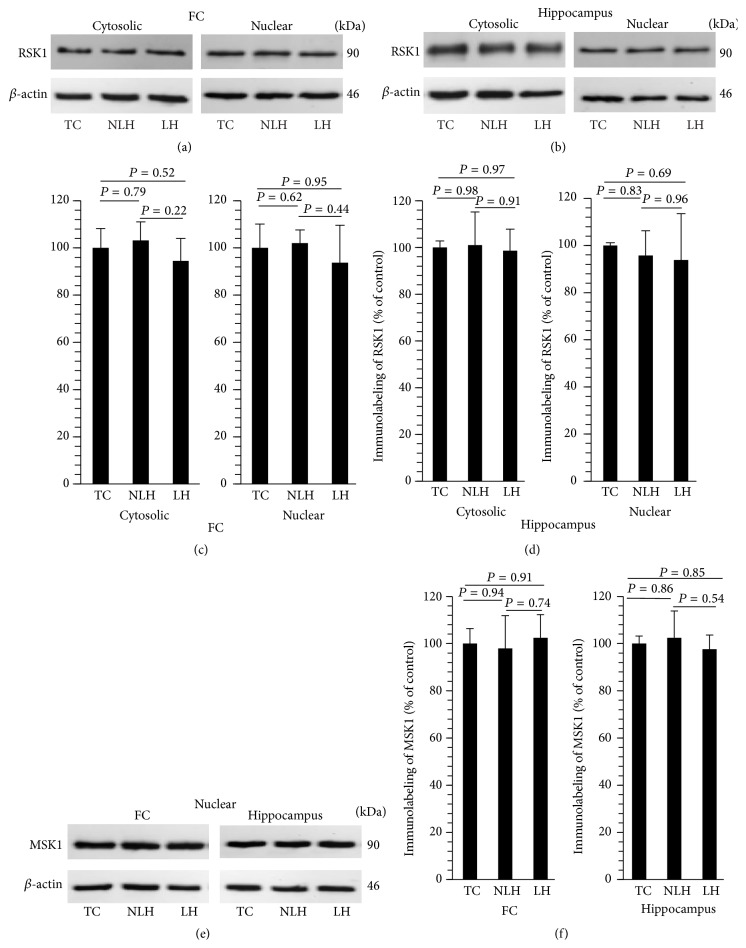
Figure 10.
Representative immunoblots of total RSK1 in cytosolic and nuclear fractions of frontal cortex (FC) (a) and hippocampus (b) and MSK1 in nuclear fractions of FC and hippocampus (d) obtained from tested control (TC), non-learned helpless (non-LH), and learned helpless (LH) rats. β-actin was used as endogenous control. Differences in expression of RSK1 and MSK1 in FC and hippocampus between TC, non-LH, and LH rats are shown in (c) and (e), respectively. Data are the mean ± SD from 6 rats in each group. Overall group differences for RSK1 among TC, non-LH, and LH rats are as follows. FC, cytosolic: df = 2,15, F = 1.58, and P = 0.23; nuclear: df = 2,15, F = 0.85, and P = 0.44. Hippocampus, cytosolic: df = 2,15, F = 0.08, and P = 0.92; nuclear: df = 2,15, F = 0.36, and P = 0.70. Overall group differences for MSK1 in nuclear fraction among TC, non-LH, and LH rats are as follows. FC: df = 2,15, F = 0.27, and P = 0.76; hippocampus: df = 2,15, F = 0.58, and P = 0.57. No significant differences were found in expression of RSK1 or MSK1 in any brain area.

