
Figure 2. Change patterns of base temperatures and temperature trends with altitude and latitude for the 2781 available stations around the globe.
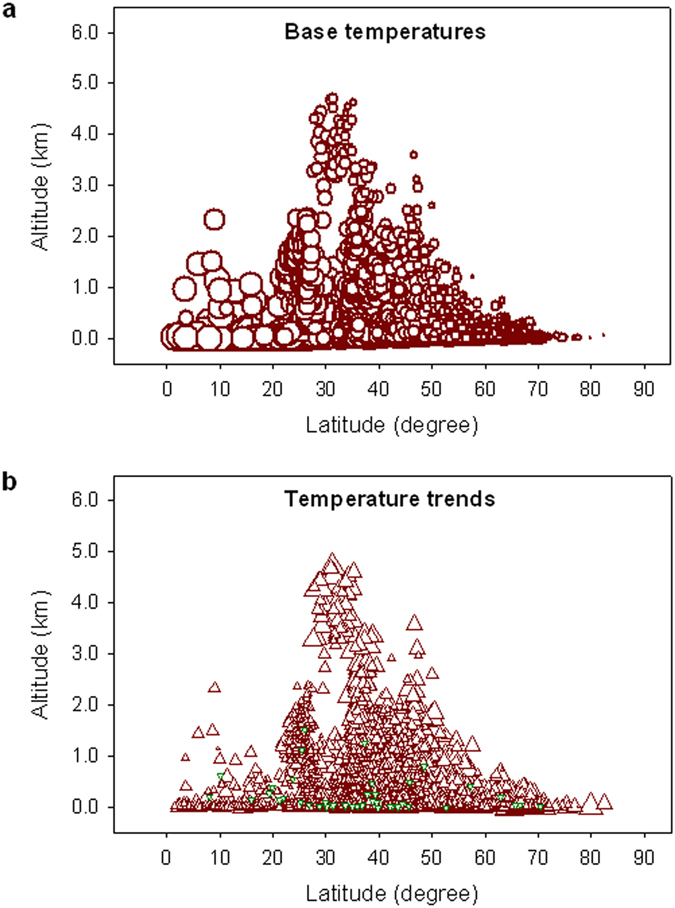
(a) Dark red circles, from largest to smallest, represent the base annual mean temperatures at individual stations from 30 °C to −20 °C in intervals of 5 °C. (b) Dark red upward triangles, from smallest to largest, represent 50-year warming trends from 0 °C to about 3.5 °C 50-yr−1 in intervals of 0.5 °C, while dark green downward triangles stand for cooling trends down to about −1.0 °C 50-yr−1over the period 1961–2010.