
Figure 4. Elevation-dependent warming and latitude-dependent warming.
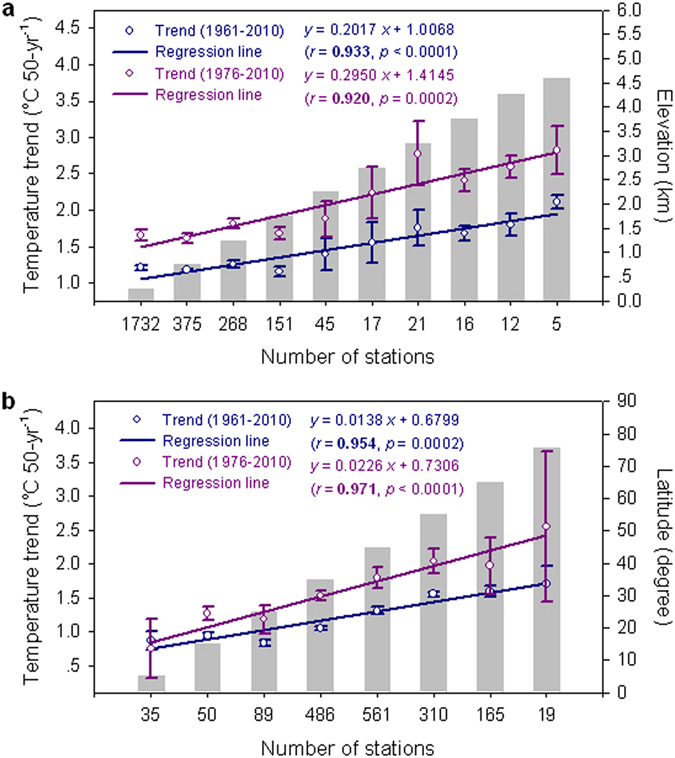
(a) Elevation-dependent warming for the 910 high-elevation stations and their 1732 low-elevation counterparts located in the same latitudes (3.40 °N/S−63.25 °N/S). Bars represent elevation, and trend magnitude is plotted on the y axis according to the 10 elevation ranks of 2642 stations. (b) Latitude-dependent warming for the 184 low-elevation stations in the Arctic region (north of 60 °N) and their 1531 lower latitude counterparts (0 °N−60 °N) at the same altitudes (0−500 m a.s.l). Bars represent latitude, and trend magnitude is plotted on the y axis according to the 8 latitude ranks of 1715 stations. Error bars denote one standard error around the mean. Pearson correlation coefficient (r) between trend magnitude and elevation (latitude) is shown with two-tailed p value. Significant coefficient, at the 95% confidence level, is set in bold.