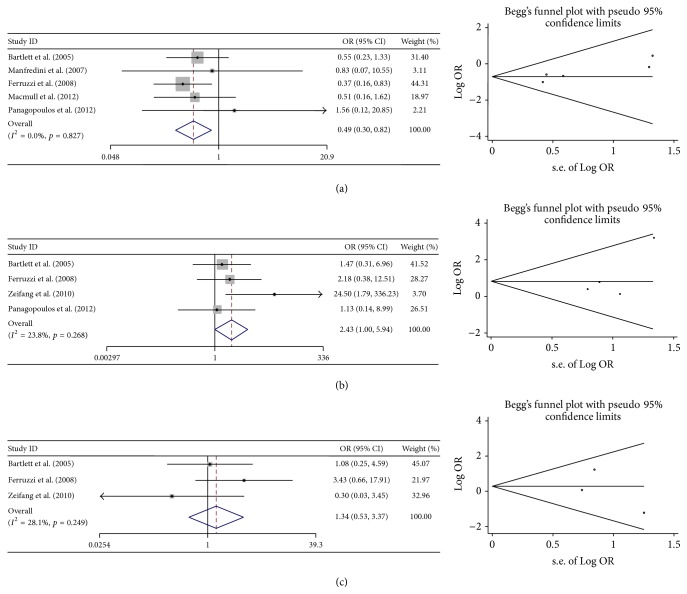
Figure 4.
Forest plots and Begg's funnel plots of studies comparing the traditional ACI with MACT. (a) Forest plots and Begg's funnel plots conducted by using the number of patients achieved excellent and good results. (b) Forest plots and Begg's funnel plots conducted by using the incidence of graft hypertrophy. (c) Forest plots and Begg's funnel plots conducted by using the frequency of reoperation.

