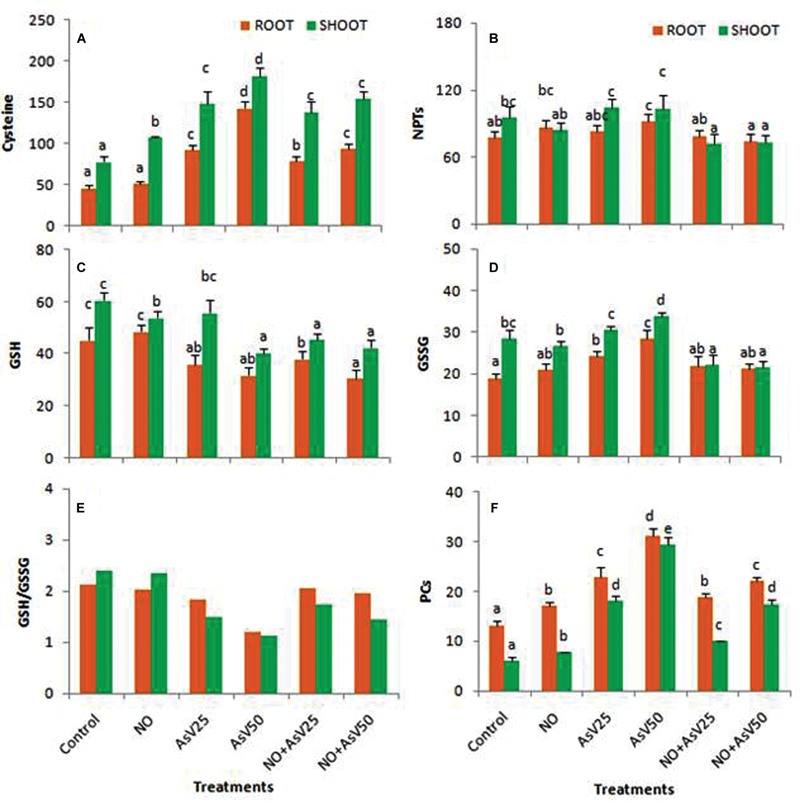
FIGURE 4.

Effect on (A) Cysteine (nMol g-1fw), (B) NPT (μMol g-1fw), (C) GSH (μMol g-1fw), (D) GSSG (μMol g-1fw), (E) Ratio of GSH/GSSG, (F) Phytochelatins (PCs; μMol g-1fw)in the rice after 7 days of treatment with different combinations of NO and AsV. Values marked with same alphabets are not significantly different (DMRT, p < 0.05). All the values are means of four replicates ±SD.
