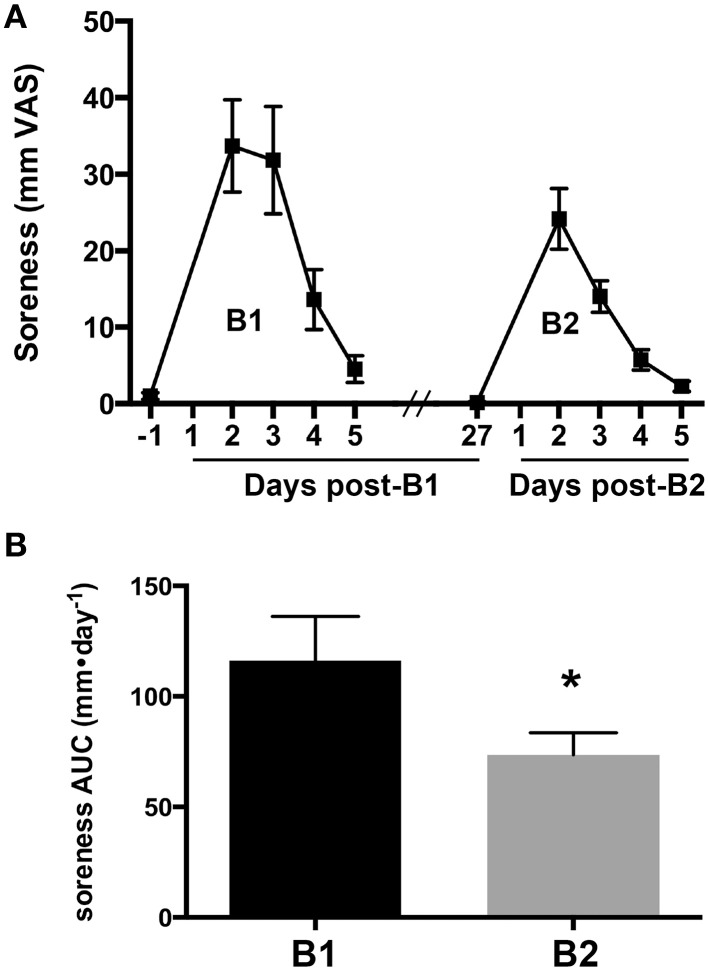
Figure 1.
Delayed onset muscle soreness as an indirect marker of muscle damage. (A) Soreness response curves measured on a visual analog scale (VAS) for 1 day before and 5 days following the first (B1) and second bouts (B2) of lengthening contractions (LC). (B) The area under the curve (AUC) for muscle soreness for B1 and B2. * Indicates significant difference (paired t-test, p < 0.05).

