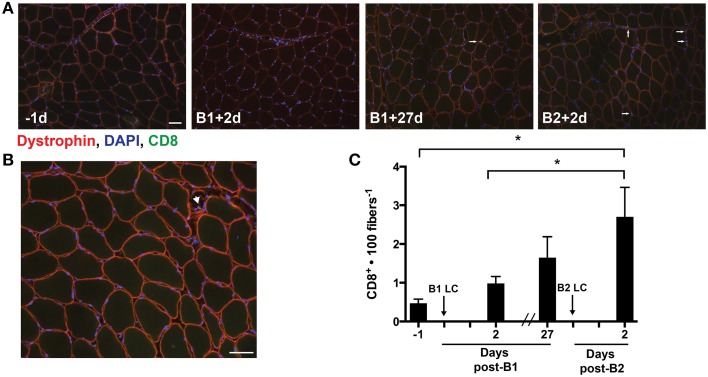
Figure 4.
Muscle-infiltrating CD8+ T-cells. (A) Eight micrometer thick sections stained for dystrophin (red), DNA (blue), and CD8 (green). All four images were taken from muscle samples 1 day before bout 1 (B1) of damaging lengthening contractions (LC) (−1d), 2 days after B1 (B1 + 2d), 27 days after bout 1 (B1 + 27d) and two days after bout 2 (B2) (B2 + 2d). The arrows show a CD8+ T-cell as evidenced by CD8 immunoreactivity localized around a DAPI-positive nucleus. (B) Merged image reveals the CD8+ T-cell invading an apparently necrotic fiber. (C) CD8+ T-cell enumeration per muscle fiber before and 2 days following the first (B1) and second bout (B2) of damaging lengthening contractions (LC). * Indicates significant difference (One-way repeated measures ANOVA with Tukey's HSD, p < 0.05). Scale bar = 50 μm.

