
Fig. 4.
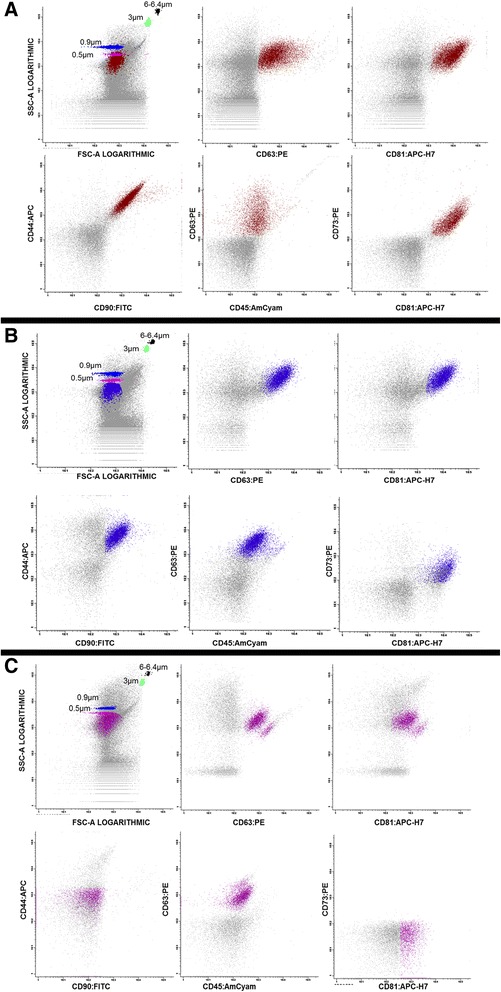
EV analysis of the different mesenchymal cell lines (hTERT and HS-5) and leukemia cell line (K562) the data is represented in dotplots. EV stained with hematopoietic markers (CD34 and CD45), positive markers for hMSC (CD90, CD44, CD73) and for EV markers (CD81 and CD63). a EV-hTERT cells. b EV- HS-5. c EV-K562