
Fig. 5.
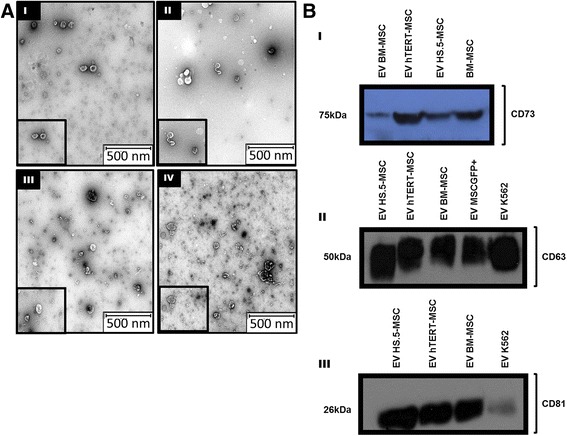
Representative images for validation of EV using TEM (a) and Western Blot (b). a I-EV-K562 cells. II-EV- BM-hMSC. III-EV-HS-5 and IV-EV-hTERT mesenchymal cell lines. Scale bar 500 nm. Original magnification: ×8000. b WB analysis of human mesenchymal protein CD75 (I) and human exosomal CD63 and CD81 proteins (II and III, respectively)