
Fig. 6.
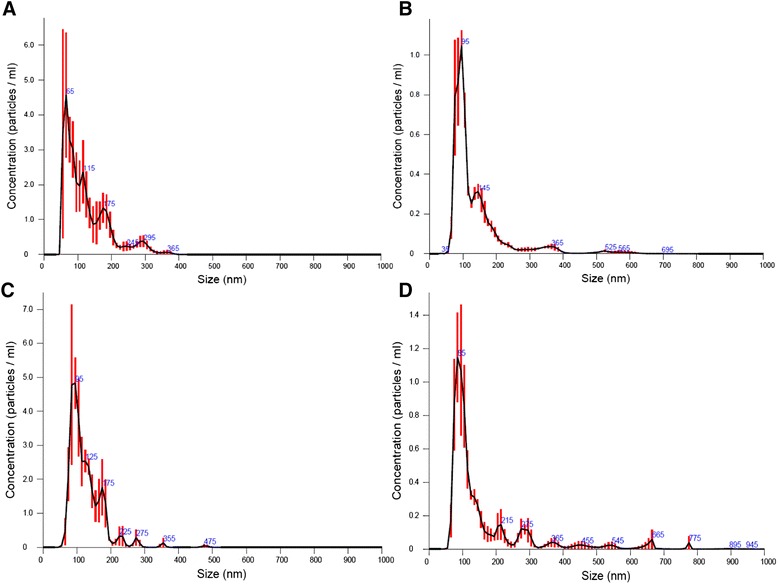
EV quantification using Nanosight nanoparticle tracking analysis. hMSC cells produced EV in cell culture with a mean size of 136 ± 86,8 nm, with a homogenous EV population. Cell lines hTERT and HS.5 (mesenchymal lines) and K562 cells (Leukemia cell line) also produce EV with size similar to EV–hMSC a - EV-K562; b - EV-BM-hMSC; c - EV-HS-5; d - EV-hTERT