Abstract
Background
Rice (Oryza sativa L.) is one of the most important cereal crops in the world and its yield is closely related to the photosynthesis efficiency. The chloroplast stromal ridge complex consisting of PsaC-PsaD-PsaE plays an important role in plant photosynthesis, which has been a subject of many studies. Till now, the recognition mechanism between PsaC and PsaD in rice is still not fully understood.
Results
Here, we present the interaction features of OsPsaC and OsPsaD by molecular dynamics simulations and bioinformatics. Firstly, we identified interacting residues in the OsPsaC-OsPsaD complex during simulations. Significantly, important hydrogen bonds were observed in residue pairs R19-E103, D47-K62, R53-E63, Y81-R20, Y81-R61 and L26-V105. Free energy calculations suggested two salt bridges R19-E103 and D47-K62 were essential to maintain the OsPsaC-OsPsaD interaction. Supportively, electrostatic potentials surfaces of OsPsaD exhibited electrostatic attraction helped to stabilize the residue pairs R19-E103 and D47-K62. In particular, the importance of R19 was further verified by two 500 ns CG-MD simulations. Secondly, this study compared the stromal ridge complex in rice with that in other organisms. Notably, alignments of amino acids showed these two salt bridges R19-E103 and D47-K62 also existed in other organisms. Electrostatic potentials surfaces and X-ray structural analysis strongly suggested the stromal ridge complex in other organisms adopted a similar and general recognition mechanism.
Conclusions
These results together provided structure basis and dynamics behavior to understand recognition and assembly of the stromal ridge complex in rice.
Electronic supplementary material
The online version of this article (doi:10.1186/s12859-016-0877-0) contains supplementary material, which is available to authorized users.
Keywords: Rice (Oryza sativa L.), Chloroplast stromal ridge complex, OsPsaC and OsPsaD, Molecular dynamics simulation, Bioinformatics study
Background
Rice (Oryza sativa L.) is one of the most important cereal crops in Southeast Asia and sixty percentage of the population regard rice as the staple food in China. Improving photosynthesis efficiency can greatly increase rice yield. Photosynthesis occurs in the chloroplast and it begins when the electron is raised to a higher energy in a special chlorophyll molecule P680 of the photosystem II (PSII). Afterwards, the energy is transferred by an electron transport chain and four thylakoid membrane protein complexes are involved in the electron transferring. These complexes are photosystem I (PSI), PSII, cytochrome b6f and ATP-synthase complexes. PsaC, PsaD and PsaE of PSI are termed as “stromal ridge complex” as they locate in the stromal side of the thylakoid membrane. The main function of the stromal ridge complex is to dock electron acceptors ferredoxin and flavodoxin by PsaC binding to electron acceptors FA and FB [1].
Genetic deletion experiments [2–4] showed PsaC firstly bound to the PsaA/B heterodimer, and then PsaD bound to the prerequisite PsaA/B-PsaC complex, and finally PsaE bound to the PsaA/B-PsaC-PsaD complex. Supportively, X-ray crystallography [5, 6] exhibited PsaC, PsaD and PsaE located on the top of PsaA/B, containing a pseudo C2-symmetry [7]. This spatial conformation allows PsaC rotate around pseudo C2 symmetry by its binding to PsaA/B [7]. As the second assembly stromal ridge subunit, PsaD is supposed to bind the correctly bound-region of PsaC, while undock incorrectly-bound PsaC. Additionally, functional experiments [8, 9] showed only if PsaD bound to stromal ridge proteins, the electron acceptors FA and FB were able to maintain their final magnetic properties [8] and to reduce the ferredoxin [9].
These experimental observations together stress the importance of the PsaC-PsaD interaction in the formation of stromal ridge complex. However, the dynamics behavior of the PsaC-PsaD interaction is still obscure. Currently, the in silico studies are good complementary to experimental approaches. All-atomic (AT) and coarse grained (CG) molecular dynamics (MD) simulations can reflect protein dynamic behaviors in detail such as conformational change. Free energy calculation had been used to explore molecular mechanism [10] and drug scanning [11]. For instance, Zhang et al. [12] computed the free energy profile of lipid PS6 along its dissociation path of aquaporin V by a non-equilibrium molecular dynamics method, with the Brownian dynamics fluctuation dissipation theorem. This method was also used to determine the free energy profile of O2 along its permeation path, helping scientists to understand the dissociation constant and binding mechanics. Zhang et al. [10] employed computational alanine scanning based on the molecular mechanics generalized Born surface area (MM-GBSA) approach to identify one complex model pSOD-OsTom20. Collectively, MD simulations combined with free energy calculations were efficient approaches to explore molecular binding mechanism in the protein complex.
In this study, we explored the recognition mechanism between OsPsaC and OsPsaD (Os: Oryza sativa) by MD simulations and bioinformatics analysis. By using MD simulations, important H-bonding interactions were identified. Free energy calculations suggested two salt bridges R19-E103 and D47-K62 were essential to maintain the interaction between OsPsaC and OsPsaD. Supportively, electrostatic potentials calculations and CG-MD simulations exhibited the importance of these two salt bridges. In addition, a bioinformatics analysis showed generality of these two salt bridges in other organisms.
Methods
Generation of atomic models of OsPsaCD complex
The modeling process was performed as our previous descriptions [10, 13, 14]. The amino acid sequence of the PsaC and PsaD (OsPsaC and OsPsaD) from Oryza sativa were obtained from the NCBI (ID: gi: 11466848 and gi: 115477831). In the first homology modeling step, template structures related to the PsaC and PsaD proteins were searched against the whole Protein Data Bank [15](PDB) using the Blast algorithm. We modeled complex structure OsPsaC-OsPsaD from Oryza sativa using the crystal structure from Pisum sativum (PDB id: 2WSC) as a template through the SWISS-MODEL [16].
In this work, residue numbering in the OsPsaD starts from the 66th residue because the first 65 residues of the PsaD are not in the recognition region. This means that the first residue of the OsPsaD (Q1) in the main text is actually referred to as Q66.
MD simulation with explicit solvent
The MD simulations were performed with the GROMACS 4.5.3 software package [17] using the OPLS force field [18] and the SPC216 water model. The protonation state of ionizable groups was chosen to correspond to pH 7.0. Counterions were added to compensate the net charge of the system. The initial structure of the complex was immersed in a periodic water box. The electrostatic interactions were calculated by using the Particle-mesh Ewald (PME) algorithm [19], and the van der Waals forces were treated with a cutoff distance of 10 Å. After 3000 steps of energy minimization using a steepest descent method, the system was subject to 300 ps of equilibration at 300 K and normal pressure, using harmonic position restraints with a force constant of 1000 kJ mol−1 nm−2. The system was coupled to an external bath by the Berendsen pressure and temperature coupling method [20]. The production run was performed under the same conditions except that all position restraints were removed. The results were analyzed using the standard software tools provided by the GROMACS package [17]. Calculation of free energy landscapes was performed with in-house scripts [10, 12, 13, 21, 22]. Visualization and manipulation of the conformations was performed using the programs visual molecular dynamics [23] and Swiss-PdbViewer 3.7 [16]. The distance analysis of the nonpolar residue-pairs was performed using the R statistical software package [24].
Calculation of binding free energies by MM-GBSA
The binding free energy of the OsPsaCD was estimated by the MM-GBSA approach [25, 26]. In this study, the implicit generalized Born solvation model was used (igb = 2). The temperature was set to 300 K. Non-bonded interactions were cut off at a distance of 12 Å. The ff99 force field (Parm99) [27] was applied throughout the energy minimization and MD simulations.
In the MM-GBSA implementation of Amber 11.0 [28], the binding free energy of A + B → AB is calculated using the following thermodynamic cycle: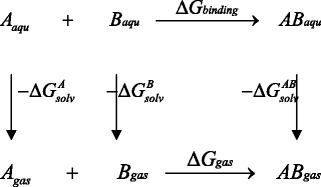
Where T is the temperature, S is the solute entropy, ΔGgas is the interaction energy between A and B in the gas phase, and ΔGAsolv, ΔGBsolv and ΔGABsolv are the solvation free energies of A, B, and AB, which are estimated using a GB surface area (GBSA) method [25, 26]. That is, ΔGABsolv = ΔGABGBSA + GABGB + ΔGABSA, and so forth. ΔGGB and ΔGSA are the electrostatic and nonpolar terms, respectively. The bond, angle, and torsion energies constitute the intramolecular energy ΔEintra of the complex, while ΔEelec and ΔEvdw represent the receptor-ligand electrostatic and van der Waals interactions, respectively. Because of the constant contribution of − TΔS for each complex, we refer to ΔG∗binding for ΔGbinding + TΔS in the discussion. To verify the quality and validity of the resulting OsPsaCD complexes, the relative binding free energy ΔG∗binding was calculated by using MM-GBSA for post processing snapshots from the MD trajectories. The computational alanine scanning method in MM-GBSA was used to evaluate the important residues. The key residues were mutated to alanine and subsequently the difference in the binding free energies between mutated and wild-type complexes was calculated based on the MM-GBSA approach.
Electrostatic potential calculations
Electrostatic potential maps were calculated with the Adaptive Poisson-Boltzmann Solver (APBS) [29] according to default parameters (physiological salt concentration of 150 mM, temperature of 298.15 K, solvent dielectric of 78.54, and solute dielectric of 2). Solute charges were distributed onto grid points using a cubic B-spline discretization. The molecular surface was defined by the interface between the radius of a water molecule (1.4 Å), and the solute van der Walls radii.
Bioinformatics analysis
To perform bioinformatics study, we followed our previous method [30] with minor modifications. The full-length PsaC (gi:743432912) and PsaD (gi:115477831) protein sequences from Oryza sativa were used as search queries. We conducted BLASTP [31] searches against the National Center for Biotechnology Information (NCBI) non-redundant database, with a cutoff E-value of 1e-10. To reflect evolutionary diversity of PsaC, we selected the following species (Table 1): four land plants (Oryza sativa, Zea mays, Blossfeldia liliputana, and Cuscuta obtusiflora), one charophyte (Chara vulgaris), one pteridophyta (Huperzia lucidula), one bryophyte (Syntrichia ruralis), one green algae (Bryopsis hypnoides), and two strains of cyanobacteria (Lyngbya sp. PCC 8106, and Chamaesiphon minutus). As to PsaD, the selected species for exhibiting evolutionary diversity were as follows: five land plants (Oryza sativa, Zea mays, Theobroma cacao, Medicago truncatula, and Glycine max), one bryophyte (Physcomitrella patens), two phaeocystis (Phaeocystis antarctica, and Phaeocystis globosa) and two green algae (Chlamydomonas reinhardtii, and Micromonas pusilla CCMP1545). To obtain the genes coding for PsaC and PsaD in these species, we used the OspsaC and OspsaD genes to conduct BLASTN searches against nucleotide databases among these organisms. Gene sequences were aligned using ClustalW [32].
Table 1.
The distances between residues corresponding to R19C and E103D in Oryza sativa
| PDB | Species | PsaC | PsaD | Distance (Å) |
|---|---|---|---|---|
| 1jb0 | Synechococcus elongatus | R18 NH1 | E103 OE2 | 6.6 |
| R18 NH2 | E103 OE1 | 4.8 | ||
| 2wsc | Pisum sativum | R19 NH1 | E121 OE2 | 3.3 |
| R19 NH2 | E121 OE1 | 6.1 | ||
| 4xk8 | Pisum sativum | R19 NH1 | E175 OE2 | 6.4 |
| R19 NH2 | E175 OE1 | 6.1 | ||
| 3lw5 | Pisum sativum | R19 NH1 | E175 OE1 | 3 |
| R19 NH2 | E175 OE2 | 5.9 | ||
| 4rku | Pisum sativum | R19 NH1 | E176 OE1 | 7.3 |
| R19 NH2 | E176 OE2 | 6.1 | ||
| 2o01 | Spinacia oleracea | R19 NH1 | E121 OE2 | 2.6 |
| R19 NH2 | E121 OE1 | 4.5 | ||
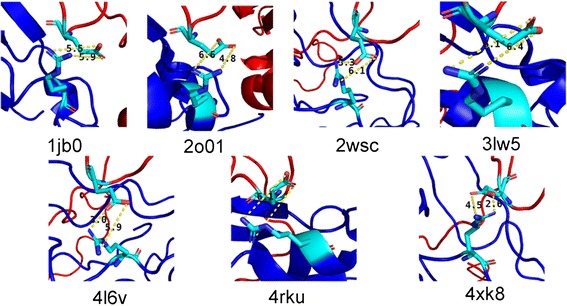
| 4l6v | Synechocystis sp. PCC 6803 | R19 NH1 | E106 OE2 | 5.5 |
| R19 NH2 | E106 OE1 | 5.9 |
Construction of the phylogenetic tree
To construct phylogenetic tree, we followed the method of Wang [33] with minor modifications. Briefly, protein sequences were aligned using MUltiple Sequence Comparison by Log- Expectation (MUSCLE) [34] and the resulting protein alignment was subjected to manual inspection in MEGA6 [35]. Phylogenetic analyses were conducted by Neighbor-Joining (NJ) [36]. The NJ phylogenetic tree was reconstructed using protein Poisson distances [37] and the pairwise-deletion of gap sites implemented in MEGA6 and was evaluated with 1000 bootstrap replicates [38].
Coarse Grained representation
This atomistic model was converted to coarse grained (CG) model using the protocol described by Marrink [39]. The MARTINI forcefield [40, 41] was used for the CG-MD simulations. Briefly, the non-H atoms were mapping to the CG standard particles and CG ring particles by 4:1 and 2–3:1 mapping schemes. Eighteen CG particle types were defined and divided into four main categories: polar (P), charged (Q), mixed polar/apolar (N) and hydrophobic apolar (C). The Lennard Jones interactions were used for the inter-particle interactions, including 10 subtypes to reflect the hydrogen bonding capabilities or polarity.
The protein backbone was represented by a single particle, while the side chain was described by zero or four particles. The Elastic Network (EN) Modeling was built across the CG backbone beads, aiming to maintain the protein secondary structure. The EN scaffold component was based on the MARTINI molecular force field [40, 41]. Two backbone beads were linked by a spring with force constant and a predefined distance cutoff value. In this study, each monomer possessed its own separate EN scaffold, using the same value of RC and KSPRING. This design will let the monomer move independently with respect to the other one during the MD simulation.
Coarse grained MD simulations
All CG-MD simulations were performed using GROMACS 4.5.3 [17]. The Berendsen weak coupling algorithm was used to maintain the temperature (coupling constant of 0.5 ps; reference temperature 300 K) and pressure (coupling constant of 1.2 ps; reference pressure 1 bar), respectively. The nonbonded interactions were treated with a switch function from 0.0 to 1.2 nm for the Coulomb interactions, and from 0.9 to 1.2 nm for the Lennard-Jones interactions. The integration time-step was set to 20 fs and the neighbor list was updated every 5 steps. Each EN system was solvated in a rectangular box with a minimum of 1.0 nm between any protein bead and the edge of the box. After energy-minimization with position restraints (1000 kJ mol-1 nm-2) applied to all protein beads, a 50 ps MD simulation using a 1 fs time-step with the same position restraints was used to relax both the solvent molecules and the protein in the force field. The system was further relaxed with 1 ns long MD run, using a 20 fs time-step and position restraints on the protein “backbone” beads. Finally each system was simulated 500 ns for production without any restraints. In order to convert the CG protein representation, four steps were used according from the protocol described by Sansom and coworkers [42]. Firstly, the backbone of the protein was grown from the CG Cα particles using the Pulchra algorithm [43]. Secondly, the missing side chain atoms of the protein were added using in MODELLER [44]. Note that the advantage of these two steps is to preserve the original coordinates from the CG particles greatly [42]. Thirdly, the protein structure was energy minimized using the conjugant gradient and steepest descents approach to reduce the internal steric clashes of the model.
Results
Stability of AT-MD simulations
To access the stability of the OsPsaC-OsPsaD complex, we monitored its structural drift with respect to the initial conformation just prior to the production MD simulation (Fig. 1a). The Cα RMSD values for OsPsaC-OsPsaD plateaued around 3 Å during simulations, exhibiting the stability of the protein complex. In addition, we monitored the secondary structure property of OsPsaC-OsPsaD during simulations, and compared it with that in S.elongatus and P.sativum (Fig. 1b). Our results suggest OsPsaC and OsPsaD were able to maintain their structural integrity during most of simulations, exhibiting our model had reached a conformational steady state.
Fig. 1.
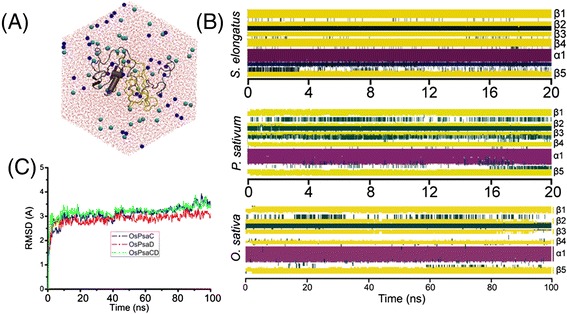
a System setup: top view of the model OsPsaC-OsPsaD complex. OsPsaC and OsPsaD were solvated in the water solvent. Shown in A was the protein in cartoon representation (OsPsaC in yellow and OsPsaD in gray), the waters in CPK representation (colored in red), and the ions in balls representation. Rendered with VMD [23]. b RMSD of the OsPsaC-OsPsaD complex with respect to the starting structure for Cα atoms of OsPsaC (blue), of OsPsaD (red), and of OsPsaC-D (green) during the 100 ns production simulation. c Time evolution of secondary structure elements in the S.elongatus, P.sativum, and O.sativa, in which β-sheets and α-helices were shown in yellow and red
Given that β-sheets were widely distributed in the structural architecture of PsaD, we evaluated the stability of β-sheets during the simulations. Fig. 2 suggested both H-binding interactions and hydrophobic interactions played important roles in maintaining β-sheets of OsPsaD. Observably, significant hydrogen-bonding interactions stabilizing the β1-β2 and β1-β3 strands were found in the residue pairs F27-V85, V29-Y83, T31-Q81, L57-I30 and L59-Y28 (Fig. 2b). In addition, we measured the hydrophobic interactions by calculating distance between the closest atoms. Fig. 2c exhibited the hydrophobic interactions in the residues pairs L56-I30, L57-V29, L57-I30, L59-F27 of the β1-β2 strand, and F27-V85, V29-F82, I30-F82 of the β1-β3 strand. Hence, the stability of β-sheets also supported our simulation system had reached its equilibrium state.
Fig. 2.
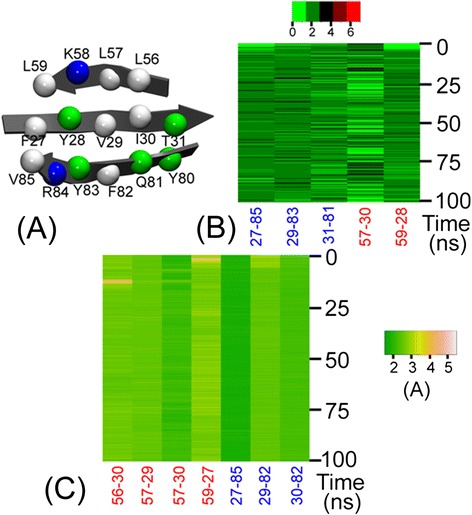
(a) Residues maintaining the stability of β-sheets in OsPsaD. The number of H-bonds (b) in residue pairs F27-V85, V29-Y83, T31-Q81, L57-I30, L59-Y28, and the distance between the closest atoms (c) in the residue pairs L56-I30, L57-V29, L57-I30, L59-F27, and F27-V85, V29-F82, I30-F82 during 100 ns MD simulation
H-bonding interactions between OsPsaC and OsPsaD
Given that the H-bonding interactions play key roles in maintaining protein stability, we analyzed the H-bonding occupancy between OsPsaC and OsPsaD during MD simulations. Two charged residues R19C and E103D were able to form a salt-bridge, occupying most of the simulation time (Fig. 3a and b). Interestingly, previous study [1] showed the importance of salt bridges in the binding of PsaC to PsaD. Thus, we also calculate the energy contribution of these two residues in the following part. In the neighbor of E103D, V105D formed the hydrophobic interaction with L26C. Besides, a salt-bridge existed in the residue pair D47-K62, which was occasionally disrupted in the middle of the simulation. In addition, we also observed some H-bonding interactions in the residue pairs R53-E63, Y81-R20 and Y81-R61. However, these interactions were not pretty stable at the beginning of simulations.
Fig. 3.
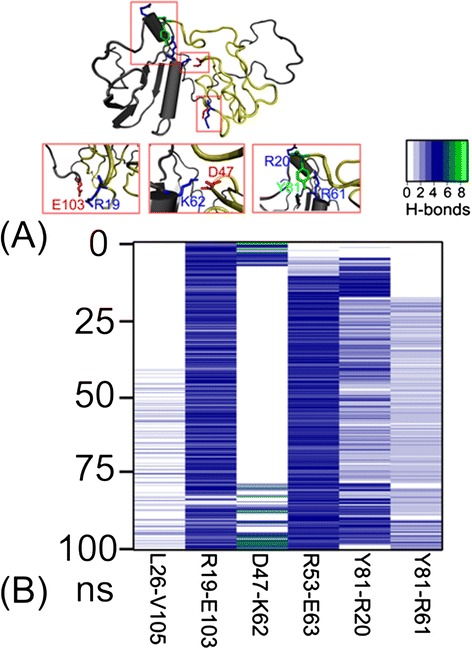
a A close view of key residues in the binding of OsPsaC to OsPsaD. b The H-bonds occupancy between the interaction residues during 100 ns MD simulations
Computational alanine scanning
To further explore the recognition residues in the OsPsaC-OsPsaD complex, we evaluated relative binding free energies by MM-GBSA, and compared interaction energy differences between the mutants and the wild-type by the computational alanine scanning (Fig. 4). We used in-silico method to construct mutants following our previous method [10] The residues were mutated to alanine, and subsequently the difference in the binding free energies between mutated and wild-type complexes was calculated based on the MM-GBSA approach. We conducted equilibrium MD simulations on the 11 independent snapshots extracting from the 100 ns simulation time. These 11 snapshots consisted of one snapshot at 0 ns, and ten snapshots from 90 ns to 100 ns.
Fig. 4.
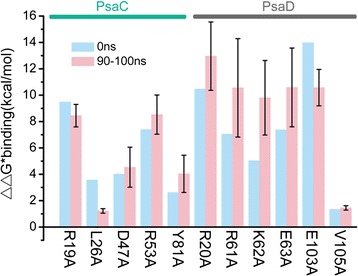
Binding affinities estimated from computational alanine scanning for mutations of the OsPsaC-OsPsaD complex ((ΔΔG ∗binding = ΔG ∗binding(mutant) − ΔG ∗binding(wild ‐ type)). ΔΔG ∗binding results for 11 single mutations in either OsPsaC or OsPsaD in the initial structure at 0 ns (green) and averaged over 10 structures at the end of the 100 ns simulation (pink; error bars represent standard deviations)
The R19A and E103A mutants induced a loss of 9.5 and 14 kcal/mol in ΔΔG∗binding scanning results in the initial structure (Fig. 4). Importance of these two residues was further supported by the values of 8.5 and 10.6 kcal/mol in the ΔΔG∗binding scanning over the last 10 ns structures. These results showed a good agreement with previous H-bonding analysis, suggesting they significantly contributed to recognition between OsPsaC and OsPsaD. Besides, two charged residues D47C and K62D lost the energy 4.0 and 5.0 kcal/mol respectively in the initial structure (Fig. 4), and 4.5, 9.8 kcal/mol over the last 10 ns snapshots when they mutated to the alanine, suggesting their importance for the recognition affinity. Also, we noticed three residues R20D, R61D and Y81C corresponded to the loss of energy 10.4, 7.0, 2.6 kcal/mol in the initial structure, and 12.9, 10.5, 4.0 kcal/mol over the last 10 ns snapshots.
CG-MD simulations
To further investigate the effect of the E103A mutation on OsPsaC-OsPsaD, two 500 ns CG-MD simulations were conducted for the wild-type (WT) system and the E103A mutant (Fig. 5). Expectantly, the salt bridge R19-E103 was able to stabilize in the WT system during the whole 500 ns simulation. This is consistent with previous results from the AT-MD simulations. Significantly, we found domain rearrangements of OsPsaC in the E103A mutant. At the beginning of CG-MD simulation, R19 and A103 can still bind tightly. However, these two subunits deviated at around 100 ns due to the disruption of their H-bonding interactions. At 500 ns, the R19-A103 interaction was thoroughly disrupted and conformational change can be observed in OsPsaC. Results from CG-MD simulations verified the importance of the salt bridge R19-E103 to maintain the OsPsaC and OsPsaD interaction.
Fig. 5.
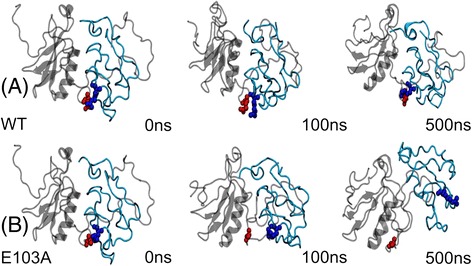
Snapshots at 0 ns, 100 ns and 500 ns were extracted from 500 ns CG-MD simulations for WT (a) and E103A mutant (b)
Electrostatic potentials maps
The Electrostatic Potential Surfaces (EPS) of PsaD was claculated with Linearized Poisson-Boltzmann Equation (LPBE) mode in the APBS package. This method solves a molecule using an algorithm of single DH sphere boundary condition and generates a 3D surface skin model colored by electrostatic potential. Dielectric constants for protein and solvent were 2.0 and 78.0 in the calculations. We extracted OsPsaC-OsPsaD structures at 0 ns and 100 ns. Fig. 6 showed R19 with positive charge was embraced by negative electrostatic potentials. Similarly, the negative charged residue D47 was in the neighbor of electropositive potentials. Apparently, electrostatic attraction plays an important role in the process of OsPsaC binding to OsPsaD, which is consistent with previous energy analysis.
Fig. 6.
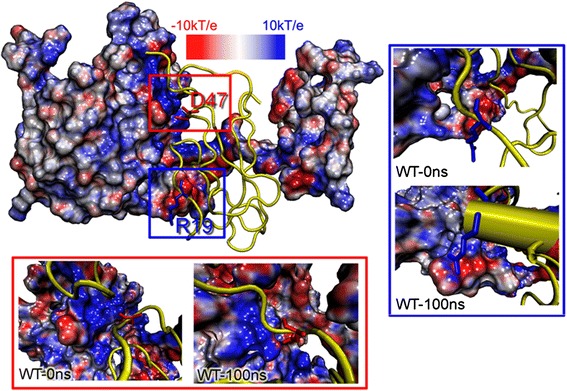
Skin representation of the molecular electrostatic potential surface (EPS) of OsPsaD at 0 ns and 100 ns according to the electrostatic potentials. Red: ESP < −10 kT/e, blue: > + 10 kcal/e, grey: between −10 and +10 kT/e
Bioinformatics analysis
To investigate if the recognition mechanism between OsPsaC and OsPsaD is a general mechanism in other organisms, we conduct amino acid homology search and sequence alignments. Using BLASTP to search protein databases in NCBI, we found the protein sequence of OsPsaC had a high similarity to the PsaC proteins in land plants. Figure 7 showed R19 and D47 of OsPsaC were identical to those in other organisms such as Z.mays, B.liliputana, C.obtusiflora, S.ruralis, B.hypnoides, C.vulgaris, H.lucidula, C.minutus, and L.sp.PCC8106. Table S1 exhibited OsPsaC shares a similarity of 99 % identity to ZmPsaC from Z.mays, 95 % identity to BlPsaC from B.liliputana. The gene sequence of OsPsaC shares a similarity of 97 % identity to ZmPsaC from Z.mays, 89 % identity to BlPsaC from B.liliputana (Additional file 1: Table S2 and Figure S3). Supportively, the phylogenetic analysis exhibited OsPsaC can be clustered together with ZmPsaC and BlPsaC (Additional file 1: Figure S1). Besides, Table S2 showed the gene sequence of OspsaC shares a similarity of 79 % identity to CmpsaC from C.minutes and 76 % identity to LspsaC from L.sp. PCC 8106. This is mainly because C.minutes and L.sp. PCC 8106 are cyanbacterias, and land plants PsaC and cyanbacteria PsaC are with a different evolutionary origin (Additional file 1: Figure S1).
Fig. 7.
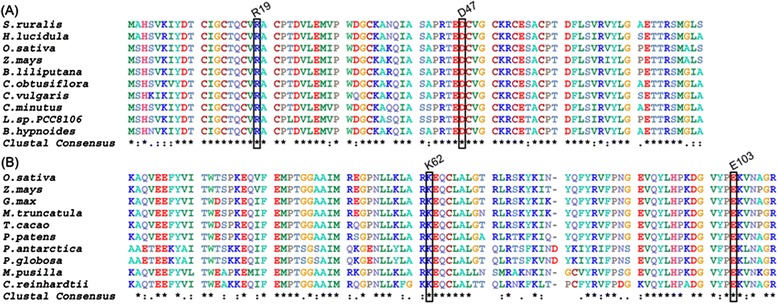
Sequence alignments of PsaC ? (a) and PsaD (b) in different organisms. Four residues R19, D47, K62 and E103 were highlighted
Figure 7 also showed E103 and K62 of OsPsaD were present in all nine other organisms: G.max, Z.mays, T.cacao, P.patens, M.pusilla, M.truncatula, C.reinhardtii, P.antarctica,and P.globosa. Significantly, Table S1 exhibited the protein sequence of OsPsaD has a high similarity to the PsaD proteins in land plants. For instance, it shares a similarity of 82 % identity to ZmPsaD from Zea mays. The phylogenetic analysis showed OsPsaD was clustered together with ZmPsaD (Additional file 1: Figure S2), emphasizing the land plants share an evolutionary origin. In addition, we found OsPsaD was not clustered with PaPsaD from P.antarctica and PgPsaD from P.globosa. Supportively, the gene sequence of OspsaD only shares 32 % identity to PapsaD and 54 % identity to PgpsaD (Additional file 1: Table S2 and Figure S4). Besides, OsPsaD was not clustered with CrPsaD from C.reinhardtii and MpPsaD from M.pusilla CCMP1545 (Additional file 1: Figure S2). Thus, OsPsaD may have a different evolutionary origin from PaPsaD, PgPsaD, CrPsaD and MpPsaD.
Comparison of X-ray structures
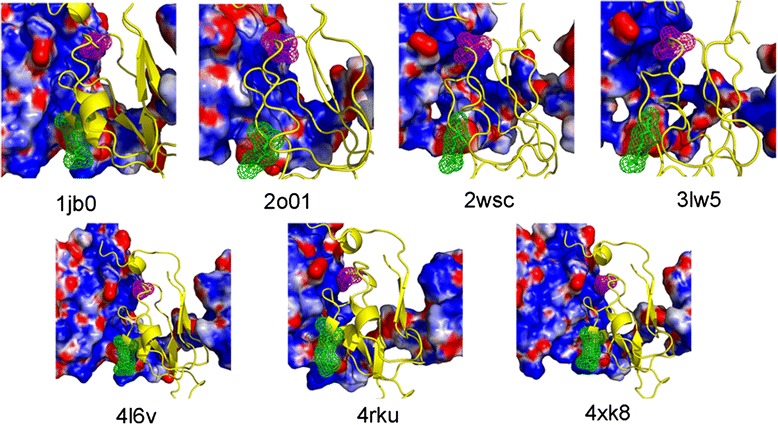
By searching the whole Protein Data Bank (http://www.rcsb.org/), we extracted seven different PsaC-PsaD complexes whose three-dimensional structures were known by X-ray technique. These seven structures were from four different organisms: Synechococcus elongatus (PDB: 1jb0), Pisum sativum (PDB: 2wsc, 4xk8, 3lw5, 4rku), Spinacia oleracea (PDB: 2o01) and Synechocystis sp. PCC 6803 (PDB: 4l6v). We calculated the EPS of PsaD using the APBS package. Figure 8 suggested the D47 binding region of PsaD was strongly electropositive. This region was widely distributed and had a tendency to form a positive pocket. Besides, the region of PsaD facing R19 of PsaC was electronegative, which was partially embraced by its neighboring electropositive region. These observations showed the charge distribution on the surface of PsaD played important roles for orienting residues E47 and R19 of PsaC, and the proper interactions between PsaC and PsaD was initiated by electrostatic forces.
Fig. 8.
Skin representation of the EPS of PsaD extracted from the X-ray structures. Red: ESP < −5 kT/e, blue: > + 5 kcal/e, grey: between −5 and +5 kT/e. Residues corresponding to R19 and D47 of OsPsaC were shown in their mesh surfaces (R19 is shown in green and D47 is shown in magentas)
Besides, we also examined the salt bridge of R19-E103 in other X-ray structures, the formation of which is thought to be the main reason to stabilize the OsPsaC-OsPsaD complex. Figure 9 and Table 1 showed the NH1 and NH2 atoms of R19 were juxtaposed against the OE1 and OE2 atoms of E103, suggesting the salt bridge of R19-E103 widely existed in other organisms. Particularly in two higher plants Pisum sativum and Spinacia oleracea, the atomic distances between NH1 of arginine and OE2 of glutamic acid were 3.3 and 2.6 Å, which were similar with that in Orysa sativa. Interestingly, in two blue-green alagas Synechocystis sp. PCC 6803 and Synechococcus elongatus, the residual distances between arginine and glutamic acid were a little far. We noticed the atomic distances between NH2 of arginine and OE1 of glutamic acid were 5.9 and 4.8 Å, indicating evolutionary diversity between higher plants and alagas.
Fig. 9.
A close view of the salt bridge between R19C and E103D in different X-ray structures. PsaC was shown in blue and PsaD was shown in red. Residues corresponding to R19C and E103D in Orysa sativa were shown in their stick representation
Validation of the MD model by protein docking
Given that our findings based on computational simulations, it is therefore necessary to apply the complementary method to validate these results. To this end, we performed the protein docking experiment using ClusPro 2.0 [31, 45–47] due to its success in the CAPRI (Critical Assessment of Predicted Interaction). We used OsPsaD and OsPsaC as receptor and ligand for docking. Free energy scores of each cluster were used to screen candidates because they can provide good hints according to our previous work [10]. Significantly, we found two docking models exhibiting better scores. The scores for the docking model 1 and 2 were −723.9 and −824.9 kcal/mol, suggesting they were favorable binding modes. After superimposing the MD model and two docking models, we found these three models were able to fit well with each other (Additional file 1: Figure S5) and the C-terminal loop of PsaD can form a long arm to interact with PsaC. Taking a closer look at residues R19C, D47C, K62D and E103D, we observed two salt bridges R19–E103 and D47-K62 at the PsaC-PsaD interfaces (Additional file 1: Figure S5). This stressed the importance of these two salt bridges in maintaining the interaction between PsaC and PsaD.
Discussion
A 2011 proteomic experiment [13] showed the stromal ridge complex of rice existed both in its PSI core complex and PSI super complex. Subsequently, this complex was modeled and refined by 15 ns MD simulation. Due to time limitation of simulations, the dynamics behaviors of the stromal ridge complex were still poorly evaluated. In this study, we combined a 100 ns AT-MD simulation and 500 ns CG-MD simulations to explore possible recognition mechanism between these two proteins. The most significant outcome of this study is that we identified two salt bridges R19-E103 and D47-K62, playing key roles to maintain the interaction between OsPsaC and OsPsaD. H-bonds analysis and free energy calculation suggested they contributed significantly to binding affinity between OsPsaC and OsPsaD. Specifically, electrostatic potential surfaces exhibited electrostatic attraction function in maintaining the interface of the OsPsaC-OsPsaD complex. In addition, CG-MD simulations emphasized the importance of salt bridge R19-E103 during the process of OsPsaC recognizing OsPsaD, the disruption of which would induce a significant conformational change of OsPsaC. Sequence alignments indicated the full sequence of OsPsaC’s was relatively conservative, and in particular, two residues R19 and D47 of PsaC in O.sativa were 100 % identical to those in other organisms. As to OsPsaD, its sequence exhibited little discrepancy in different organisms. For instance, PsaD in O.sativa, P.patens, P.antarctica and P.globosa lost partial of their N-terminal residues, indicating diversity of photosynthesis systems in different organisms during evolution. Interestingly, residues E103 and K62 of PsaD in O.sativa are 100 % identical to those in other organisms, strongly suggesting conservatively of two salt-bridges R19-E103 and D47-K62 in most of the organisms.
This study focused on the recognition mechanism of OsPsaC and OsPsaD since previous studies [3, 4] suggested the binding of PsaD to PsaC can greatly affect the assembly of the stromal ridge complex. Genetics experiments showed the in-vivo psaC deletion mutant lacked the subunit PsaD [4], while the psaD deletion mutant still contained PsaC [3]. This suggested PsaD was able to bind PsaC, only after the binding of PsaC to PsaA/B. It should be noted that residues distributing on PsaA/B heterodimer were highly symmetric, allowing PsaC rotate around the pseudo C2 symmetry of PsaA/B. This will lead half probability for the binding of PsaC to PsaA/B in its correct orientation, while also half possibility to bind incorrectly [7]. The binding of PsaD to PsaC is important because it can lock the region of PsaC correctly bound to PsaA/B, which is also supported by our in silico data. The binding free energies correlated well with previous structural analysis [1], emphasizing the H-bonding interactions play important roles in OsPsaD locking the correctly bound-region of OsPsaC and undocking the incorrectly bound-region of OsPsaD. Additionally, previous genetics experiments [2] also showed the psaE deletion mutant contained both PsaC and PsaD, indicating PsaE is the last stromal ridge protein to bind the PsaA/B-PsaC-PsaD complex and the PsaC-PsaD prerequisite complex is essential for the PsaE assembly.
Our simulations also explained how β-sheets of PsaD maintain their structure integrity and stability. The secondary structure of β-sheets was widely distributed in PsaD. Nuclear magnetic resonance (NMR) experiment [48] showed the free PsaD structure contained 11 % β-sheets. X-ray crystallography [5, 6] showed PsaD contained four β-sheets and one α-helix was connected by two neighboring β-sheets. Thus, it is interesting to understand how β-sheets maintain their stability. Our result stressed both H-bonding and hydrophobic interactions were essential to stabilize β-sheets, indicating the plausible mechanism of general distribution of β-sheets [5, 6, 48].
Conclusions
The correctly binding of PsaC to PsaD is a key step to form chloroplast stromal ridge complex, which plays important roles in plant photosynthesis. However, the recognition mechanism and dynamics behaviors of PsaC-PsaD are still obscure. This work aims to identify the key interactions between OsPsaC and OsPsaD by MD simulations and bioinformatics. Observably, a salt bridge R19-E103 is essential to maintain the stability of OsPsaC-OsPsaD. Its importance is determined in combination of free energy calculation and electrostatic potentials map, and is subsequently verified by two 500 ns CG-MD simulations.
On the other hand, we are also interested in if the recognition mechanism generally exists in the other organisms. To this end, we conduct amino acid homology search and sequence alignments. The results strongly suggest salt-bridges forming residues are relatively conservative. After comparison of different stromal ridge complexes from previous X-ray structures, we notice electrostatic forces provide proper interactions between PsaC and PsaD. Particularly, residues corresponding to R19C and E103D in rice are also able to form the stable salt bridge. This supports the generality of R19-E103 in other organisms. Collectively, this work will provide dynamics behaviors to understand recognition mechanism of the stromal ridge complex in rice.
Acknowledgements
The authors thank Junjie Yan, Jinzhen Shao for their insightful comments on the manuscript.
Funding
This study was supported by “973” Program of China (2013CB126900) and National Nature Science Foundation of China (NSFC 31471464).
Abbreviations
- AT-MD
ATomic Molecular Dynamics
- CG-MD
Coarse grained molecular dynamics
- Cα
Alpha-Carbon
- MD
Molecular dynamics
- MM-GBSA
Molecular mechanics generalized born surface area
- Os
Oryza sativa
- PsaA/B
Subunits A and B of photosystem I
- PsaC/D/E
Subunits C, D and E of photosystem I
- RMSD
Root mean square distance
- WT
Wild type
Additional file
Identification of the PsaC and PsaD proteins from the NCBI database in this study. Sequence identity to OsPsaC and OsPsaD were listed. Table S2. Identification of the psaC and psaD genes from the NCBI database in this study. Sequence identity to OspsaC and OspsaD were listed. Figure S1. Phylogenetic tree of the PsaC proteins. The numbers associated with the branches are bootstrap values. Species names are color-coded as follows: green → land plants, light green → charophyte, blue → pteridophyta, light blue → bryophyta, purple → green algae, and black → cyanobacteria. The tree was deposited in TreeBASE under submission ID 18661. Figure S2. Phylogenetic tree of PsaD proteins. The numbers associated with the branches are bootstrap values. Species names are color-coded as follows: green → land plants, light green → bryophyta, black → phaeocystis, and blue → green algae. The tree was deposited in TreeBASE under submission ID 18661. Figure S3. Sequences alignments of the psaC genes. The sequences encoding R19 and D47 are highlighted. The color code indicates consistency between pairwise alignments (red: high, yellow: middle, blue: low). Figure S4. Sequences alignments of the psaD genes. The sequences encoding K62 and E103 are highlighted. The color code indicates consistency between pairwise alignments (red: high, yellow: middle, blue: low). Figure S5. Two docking models are superimposed with the MD model. Two salt bridges R19-E103 and D47-K62 are highlighted in their vdW representations. (DOCX 1149 kb)
Footnotes
Competing interests
The authors declare that they have no competing interests.
Authors’ contributions
YD and YZ conceived and designed the experiments. YZ performed the molecular dynamics simulation and bioinformatics study. YZ and YD wrote the paper. Both authors read and approved the final manuscript.
Contributor Information
Yubo Zhang, Email: zhyubo7@gmail.com.
Yi Ding, Phone: +86-27-68754319, Email: yiding@whu.edu.cn.
References
- 1.Antonkine ML, Jordan P, Fromme P, Krauss N, Golbeck JH, Stehlik D. Assembly of protein subunits within the stromal ridge of photosystem I. Structural changes between unbound and sequentially PS I-bound polypeptides and correlated changes of the magnetic properties of the terminal iron sulfur clusters. J Mol Biol. 2003;327(3):671–97. doi: 10.1016/S0022-2836(03)00145-1. [DOI] [PubMed] [Google Scholar]
- 2.Zhao J, Snyder WB, Muhlenhoff U, Rhiel E, Warren PV, Golbeck JH, et al. Cloning and characterization of the psaE gene of the cyanobacterium Synechococcus sp. PCC 7002: characterization of a psaE mutant and overproduction of the protein in Escherichia coli. Mol Microbiol. 1993;9(1):183–94. doi: 10.1111/j.1365-2958.1993.tb01680.x. [DOI] [PubMed] [Google Scholar]
- 3.Chitnis VP, Jungs YS, Albee L, Golbeck JH, Chitnis PR. Mutational analysis of photosystem I polypeptides. Role of PsaD and the lysyl 106 residue in the reductase activity of the photosystem I. J Biol Chem. 1996;271(20):11772–80. doi: 10.1074/jbc.271.20.11772. [DOI] [PubMed] [Google Scholar]
- 4.Yu J, Smart LB, Jung YS, Golbeck J, McIntosh L. Absence of PsaC subunit allows assembly of photosystem I core but prevents the binding of PsaD and PsaE in Synechocystis sp. PCC6803. Plant Mol Biol. 1995;29(2):331–42. doi: 10.1007/BF00043656. [DOI] [PubMed] [Google Scholar]
- 5.Amunts A, Toporik H, Borovikova A, Nelson N. Structure determination and improved model of plant photosystem I. J Biol Chem. 2010;285(5):3478–86. doi: 10.1074/jbc.M109.072645. [DOI] [PMC free article] [PubMed] [Google Scholar]
- 6.Jordan P, Fromme P, Witt HT, Klukas O, Saenger W, Krauss N. Three-dimensional structure of cyanobacterial photosystem I at 2.5 A resolution. Nature. 2001;411(6840):909–17. doi: 10.1038/35082000. [DOI] [PubMed] [Google Scholar]
- 7.Jagannathan B, Golbeck JH. Breaking biological symmetry in membrane proteins: the asymmetrical orientation of PsaC on the pseudo-C2 symmetric Photosystem I core. Cell Mol Life Sci. 2009;66(7):1257–70. doi: 10.1007/s00018-009-8673-x. [DOI] [PMC free article] [PubMed] [Google Scholar]
- 8.Li N, Zhao JD, Warren PV, Warden JT, Bryant DA, Golbeck JH. PsaD is required for the stable binding of PsaC to the photosystem I core protein of Synechococcus sp. PCC 6301. Biochemistry. 1991;30(31):7863–72. doi: 10.1021/bi00245a028. [DOI] [PubMed] [Google Scholar]
- 9.Barth P, Lagoutte B, Setif P. Ferredoxin reduction by photosystem I from Synechocystis sp. PCC 6803: toward an understanding of the respective roles of subunits PsaD and PsaE in ferredoxin binding. Biochemistry. 1998;37(46):16233–41. doi: 10.1021/bi981379t. [DOI] [PubMed] [Google Scholar]
- 10.Zhang Y, Baaden M, Yan J, Shao J, Qiu S, Wu Y, et al. The molecular recognition mechanism for superoxide dismutase presequence binding to the mitochondrial protein import receptor Tom20 from Oryza sativa involves an LRTLA motif. J Phys Chem B. 2010;114(43):13839–46. doi: 10.1021/jp103547s. [DOI] [PubMed] [Google Scholar]
- 11.Han S, Yi H, Yin SJ, Chen ZY, Liu H, Cao ZJ, et al. Structural basis of a potent peptide inhibitor designed for Kv1.3 channel, a therapeutic target of autoimmune disease. J Biol Chem. 2008;283(27):19058–65. doi: 10.1074/jbc.M802054200. [DOI] [PubMed] [Google Scholar]
- 12.Zhang Y, Chen LY. In silico study of Aquaporin V: Effects and affinity of the central pore-occluding lipid. Biophys Chem. 2013;171:24–30. doi: 10.1016/j.bpc.2012.09.004. [DOI] [PMC free article] [PubMed] [Google Scholar]
- 13.Shao J, Zhang Y, Yu J, Guo L, Ding Y. Isolation of Thylakoid Membrane Complexes from Rice by a New Double-Strips BN/SDS-PAGE and Bioinformatics Prediction of Stromal Ridge Subunits Interaction. PLoS ONE. 2011;6(5):e20342. doi: 10.1371/journal.pone.0020342. [DOI] [PMC free article] [PubMed] [Google Scholar]
- 14.Yan J, Zhang Y, Ding Y. Binding mechanism between Hsp90 and Sgt1 explored by homology modeling and molecular dynamics simulations in rice. J Mol Model. 2012;18(10):4665–73. doi: 10.1007/s00894-012-1464-6. [DOI] [PubMed] [Google Scholar]
- 15.Berman HM, Westbrook J, Feng Z, Gilliland G, Bhat TN, Weissig H, et al. The Protein Data Bank. Nucleic Acids Res. 2000;28(1):235–42. doi: 10.1093/nar/28.1.235. [DOI] [PMC free article] [PubMed] [Google Scholar]
- 16.Guex N, Peitsch MC. SWISS-MODEL and the Swiss-PdbViewer: an environment for comparative protein modeling. Electrophoresis. 1997;18(15):2714–23. doi: 10.1002/elps.1150181505. [DOI] [PubMed] [Google Scholar]
- 17.Van Der Spoel D, Lindahl E, Hess B, Groenhof G, Mark AE, Berendsen HJ. GROMACS: fast, flexible, and free. J Comput Chem. 2005;26(16):1701–18. doi: 10.1002/jcc.20291. [DOI] [PubMed] [Google Scholar]
- 18.Jorgensen WL, Maxwell DS, Tirado-Rives J. Development and Testing of the OPLS All-Atom Force Field on Conformational Energetics and Properties of Organic Liquids. J Am Chem Soc. 1996;118(45):11225–36. doi: 10.1021/ja9621760. [DOI] [Google Scholar]
- 19.Essmann U, Perera L, Berkowitz M, Darden T, Lee H, Pedersen L. A smooth particle mesh Ewald method. J Chem Phys. 1995;103(19):8577–93. doi: 10.1063/1.470117. [DOI] [Google Scholar]
- 20.Berendsen HJC, Postma JPM, van Gunsteren WF, DiNola A, Haak JR. Molecular dynamics with coupling to an external bath. J Chem Phys. 1984;81(8):3684–90. doi: 10.1063/1.448118. [DOI] [Google Scholar]
- 21.Zhang Y. Understanding the impact of Fc glycosylation on its conformational changes by molecular dynamics simulations and bioinformatics. Molecular BioSystems. 2015;11(12):3415–3424. doi: 10.1039/C5MB00602C. [DOI] [PubMed] [Google Scholar]
- 22.Zhang Y, Cui Y, Chen LY. Mercury inhibits the L170C mutant of aquaporin Z by making waters clog the water channel. Biophys Chem. 2012;160(1):69–74. doi: 10.1016/j.bpc.2011.07.006. [DOI] [PMC free article] [PubMed] [Google Scholar]
- 23.Humphrey W, Dalke A, Schulten K. VMD: visual molecular dynamics. J Mol Graph. 1996;14(1):33–8. doi: 10.1016/0263-7855(96)00018-5. [DOI] [PubMed] [Google Scholar]
- 24.Team, RC - 2014 R: A language and environment for statistical computing. R Foundation for Statistical Computing, Vienna, Austria, 2012.
- 25.Qiu D, Shenkin P, Hollinger F, Still C. The GB/SA Continuum Model for Solvation. A Fast Analytical Method for the Calculation of Approximate Born Radii. J Phys Chem A. 1997;101(16):3005–14. doi: 10.1021/jp961992r. [DOI] [Google Scholar]
- 26.Tsui V, Case DA. Molecular Dynamics Simulations of Nucleic Acids with a Generalized Born Solvation Model. J Am Chem Soc. 2000;122(11):2489–98. doi: 10.1021/ja9939385. [DOI] [Google Scholar]
- 27.Wang J, Cieplak P, Kollman P. How well does a restrained electrostatic potential (RESP) model perform in calculating conformational energies of organic and biological molecules? J Comput Chem. 2000;21(12):1049–74. doi: 10.1002/1096-987X(200009)21:12<1049::AID-JCC3>3.0.CO;2-F. [DOI] [Google Scholar]
- 28.Case DA, Darden TA, TE Cheatham I, Simmerling CL, Wang J, Duke RE, et al. AMBER 11. San Francisco: University of California; 2010. [Google Scholar]
- 29.Baker NA, Sept D, Joseph S, Holst MJ, McCammon JA. Electrostatics of nanosystems: application to microtubules and the ribosome. Proc Natl Acad Sci U S A. 2001;98(18):10037–41. doi: 10.1073/pnas.181342398. [DOI] [PMC free article] [PubMed] [Google Scholar]
- 30.Wu Z, Gui S, Wang S, Ding Y. Molecular evolution and functional characterisation of an ancient phenylalanine ammonia-lyase gene (NnPAL1) from Nelumbo nucifera: novel insight into the evolution of the PAL family in angiosperms. BMC Evol Biol. 2014;14:100. doi: 10.1186/1471-2148-14-100. [DOI] [PMC free article] [PubMed] [Google Scholar]
- 31.Kozakov D, Beglov D, Bohnuud T, Mottarella SE, Xia B, Hall DR, et al. How good is automated protein docking? Proteins. 2013;81(12):2159–66. doi: 10.1002/prot.24403. [DOI] [PMC free article] [PubMed] [Google Scholar]
- 32.Thompson JD, Higgins DG, Gibson TJ. CLUSTAL W: improving the sensitivity of progressive multiple sequence alignment through sequence weighting, position-specific gap penalties and weight matrix choice. Nucleic Acids Res. 1994;22(22):4673–80. doi: 10.1093/nar/22.22.4673. [DOI] [PMC free article] [PubMed] [Google Scholar]
- 33.Wang K, Zhao H. Birds Generally Carry a Small Repertoire of Bitter Taste Receptor Genes. Genome Biol Evol. 2015;7(9):2705–15. doi: 10.1093/gbe/evv180. [DOI] [PMC free article] [PubMed] [Google Scholar]
- 34.Edgar RC. MUSCLE: multiple sequence alignment with high accuracy and high throughput. Nucleic Acids Res. 2004;32(5):1792–7. doi: 10.1093/nar/gkh340. [DOI] [PMC free article] [PubMed] [Google Scholar]
- 35.Tamura K, Stecher G, Peterson D, Filipski A, Kumar S. MEGA6: Molecular Evolutionary Genetics Analysis version 6.0. Mol Biol Evol. 2013;30(12):2725–9. doi: 10.1093/molbev/mst197. [DOI] [PMC free article] [PubMed] [Google Scholar]
- 36.Saitou N, Nei M. The neighbor-joining method: a new method for reconstructing phylogenetic trees. Mol Biol Evol. 1987;4(4):406–25. doi: 10.1093/oxfordjournals.molbev.a040454. [DOI] [PubMed] [Google Scholar]
- 37.Nei M, Kumar S. Molecular evolution and phylogenetics. New York: Oxford University Press; 2000.
- 38.Felsenstein J. Confidence Limits on Phylogenies: An Approach Using the Bootstrap. Evolution. 1985;39(4):783–91. doi: 10.2307/2408678. [DOI] [PubMed] [Google Scholar]
- 39.Periole X, Cavalli M, Marrink S-J, Ceruso MA. Combining an Elastic Network With a Coarse-Grained Molecular Force Field: Structure, Dynamics, and Intermolecular Recognition. J Chem Theory Comput. 2009;5(9):2531–43. doi: 10.1021/ct9002114. [DOI] [PubMed] [Google Scholar]
- 40.Marrink SJ, Risselada HJ, Yefimov S, Tieleman DP, de Vries AH. The MARTINI force field: coarse grained model for biomolecular simulations. J Phys Chem B. 2007;111(27):7812–24. doi: 10.1021/jp071097f. [DOI] [PubMed] [Google Scholar]
- 41.Monticelli L, Kandasamy SK, Periole X, Larson RG, Tieleman DP, Marrink S-J. The MARTINI Coarse-Grained Force Field: Extension to Proteins. J Chem Theory Comput. 2008;4(5):819–34. doi: 10.1021/ct700324x. [DOI] [PubMed] [Google Scholar]
- 42.Stansfeld PJ, Sansom MSP. From Coarse Grained to Atomistic: A Serial Multiscale Approach to Membrane Protein Simulations. J Chem Theory Comput. 2011;7(4):1157–1166. doi: 10.1021/ct100569y. [DOI] [PubMed] [Google Scholar]
- 43.Rotkiewicz P, Skolnick J. Fast procedure for reconstruction of full-atom protein models from reduced representations. J Comput Chem. 2008;29(9):1460–5. doi: 10.1002/jcc.20906. [DOI] [PMC free article] [PubMed] [Google Scholar]
- 44.Sali A, Blundell TL. Comparative protein modelling by satisfaction of spatial restraints. J Mol Biol. 1993;234(3):779–815. doi: 10.1006/jmbi.1993.1626. [DOI] [PubMed] [Google Scholar]
- 45.Comeau SR, Gatchell DW, Vajda S, Camacho CJ. ClusPro: a fully automated algorithm for protein-protein docking. Nucleic Acids Res. 2004;32(Web Server issue):W96–9. doi: 10.1093/nar/gkh354. [DOI] [PMC free article] [PubMed] [Google Scholar]
- 46.Comeau SR, Gatchell DW, Vajda S, Camacho CJ. ClusPro: an automated docking and discrimination method for the prediction of protein complexes. Bioinformatics. 2004;20(1):45–50. doi: 10.1093/bioinformatics/btg371. [DOI] [PubMed] [Google Scholar]
- 47.Kozakov D, Brenke R, Comeau SR, Vajda S. PIPER: an FFT-based protein docking program with pairwise potentials. Proteins. 2006;65(2):392–406. doi: 10.1002/prot.21117. [DOI] [PubMed] [Google Scholar]
- 48.Xia Z, Broadhurst RW, Laue ED, Bryant DA, Golbeck JH, Bendall DS. Structure and properties in solution of PsaD, an extrinsic polypeptide of photosystem I. Eur J Biochem. 1998;255(1):309–16. doi: 10.1046/j.1432-1327.1998.2550309.x. [DOI] [PubMed] [Google Scholar]


