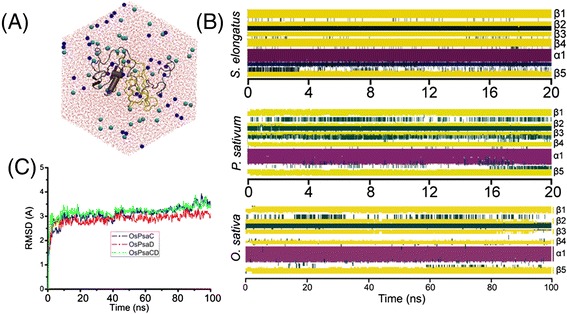
Fig. 1.

a System setup: top view of the model OsPsaC-OsPsaD complex. OsPsaC and OsPsaD were solvated in the water solvent. Shown in A was the protein in cartoon representation (OsPsaC in yellow and OsPsaD in gray), the waters in CPK representation (colored in red), and the ions in balls representation. Rendered with VMD [23]. b RMSD of the OsPsaC-OsPsaD complex with respect to the starting structure for Cα atoms of OsPsaC (blue), of OsPsaD (red), and of OsPsaC-D (green) during the 100 ns production simulation. c Time evolution of secondary structure elements in the S.elongatus, P.sativum, and O.sativa, in which β-sheets and α-helices were shown in yellow and red
