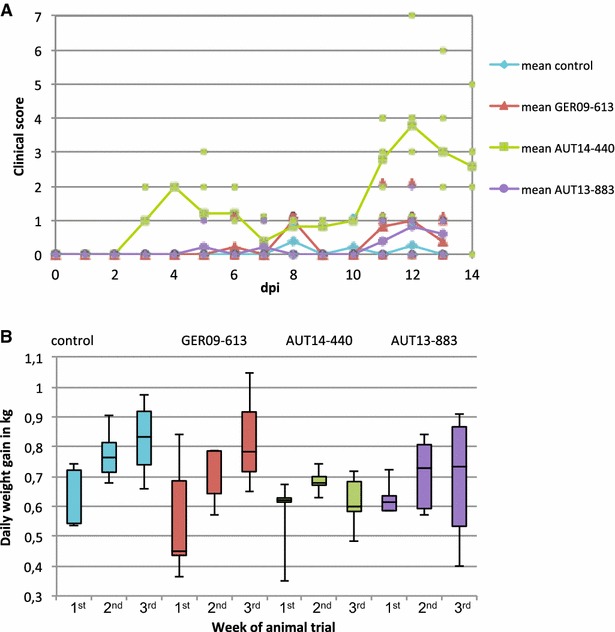
Figure 4.

Clinical signs and daily weight gain. A Pigs were examined daily and a clinical score was calculated based on the severity of PRRSV-associated clinical signs. The mean values for each group are shown with a continuous line and single spots represent individual animals. As group AUT14-440 was euthanized on day 14 pi there are values for 1 day more than for the other groups. B Pigs were weighed at six time points and daily weight gain was calculated for three time frames: 1st week (−7 to 0 dpi), 2nd week (0 to 7 dpi) and 3rd week (7 to 13 dpi) of the trial. Whiskers represent maximum and minimum values. Differences between the groups were visible for the last time period, 7–13 dpi, although they are not statistically significant (p = 0.055 between GER09-613 and AUT14-440).
