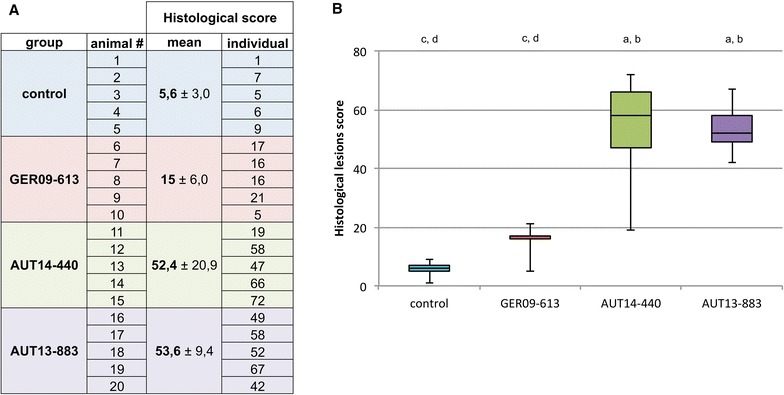
Figure 5.

Histological lung lesions. For each animal, a histopathological lung lesion score was calculated by considering the degree of PRRSV-associated lesions in every lung lobe. Histological lesion scores are presented A in a table and B as a box-plot. Mean score (±standard deviation) and individual scores for each animal are displayed for all groups. B Whiskers represent maximum and minimum values. Letters indicate significant differences (p < 0.01) from control group (a), group GER09-613 (b), group AUT14-440 (c) and group AUT13-883 (d).
