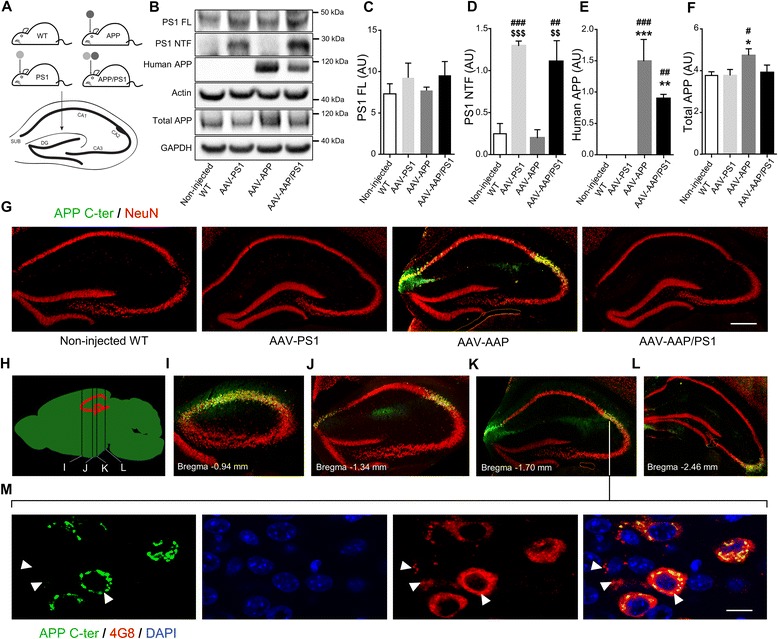
Fig. 1.

Stereotactic injection of AAV vectors induces the neuronal expression of human APP and PS1 in the hippocampus of C57BL/6 J mice, 1 month after injection. C57Bl/6 J mice (all males) were injected at 8 weeks of age either with AAV-CAG-PS1M146L (AAV-PS1 mice, n = 4), AAV-CAG-APPSL (AAV-APP mice, n = 4) or both vectors at the same doses as for the other two groups (AAV-APP/PS1 mice, n = 4). Non-injected WT mice (n = 4) were also analyzed. Mice were killed one month later for analyses. a Upper panel: schematic representation of the four groups used. Bottom panel: coronal diagram showing the injection site and the architecture of the mouse hippocampus. b Representative western blots showing the expression of PS1 (full length: PS1 FL and N-terminal fragment: PS1 NTF), human APP (6E10 antibody) and total APP (murine + human forms; APP C-ter antibody) confirming transgene expression 1 month after injection. All western blots were performed on the whole hippocampus (TBS-Tx soluble fraction). c-f Densitometric analyses of western blots showing the expression of PS1 FL (c), PS1 NTF (d), human APP (e) and total APP (f) in the four groups hippocampi 1 month after injection. Note that despite the expression of human APP in the AAV-APP/PS1 group, no significant difference in total APP levels was found between non-injected, AAV-PS1 and AAV-APP/PS1 groups. Bars represent means ± SEM and data were normalized with respect to GAPDH. Statistical analysis was performed by one-way ANOVA followed by Tukey’s post-hoc test where ###, *** and $$$ denote p < 0.001 versus non-injected WT mice, AAV-PS1 mice and AAV-APP mice respectively. ##, ** and $$ denote p < 0.01; # and * denote p < 0.05. g High magnification of a hippocampal coronal section of each group showing neuronal layers (NeuN antibody, red) and the APP expression (APP C-ter antibody, green). Note that the human APP expression in the AAV-APP/PS1 group (see Fig. 1e) is not sufficient to exceed a threshold detectable by immunohistochemistry. The exogenous APP is essentially detected into two areas: the CA2 and subiculum. Scale bar represents 500 μm. h Scheme representing antero-posterior coordinates of coronal sections depicted in (i-l). i-l Immunostaining of APP (APP C-ter antibody, green) and NeuN (red) at different antero-posterior coordinates in AAV-APP mice coronal sections. m Magnified confocal images of an AAV-APP mouse section with double immunofluorescence staining showing the location of APP (APP C-ter antibody, green) and the diffusion of Aβ indicated by arrow heads (4G8 antibody, red) in the CA2 layer. Blue: DAPI. Scale bar represents 10 μm
