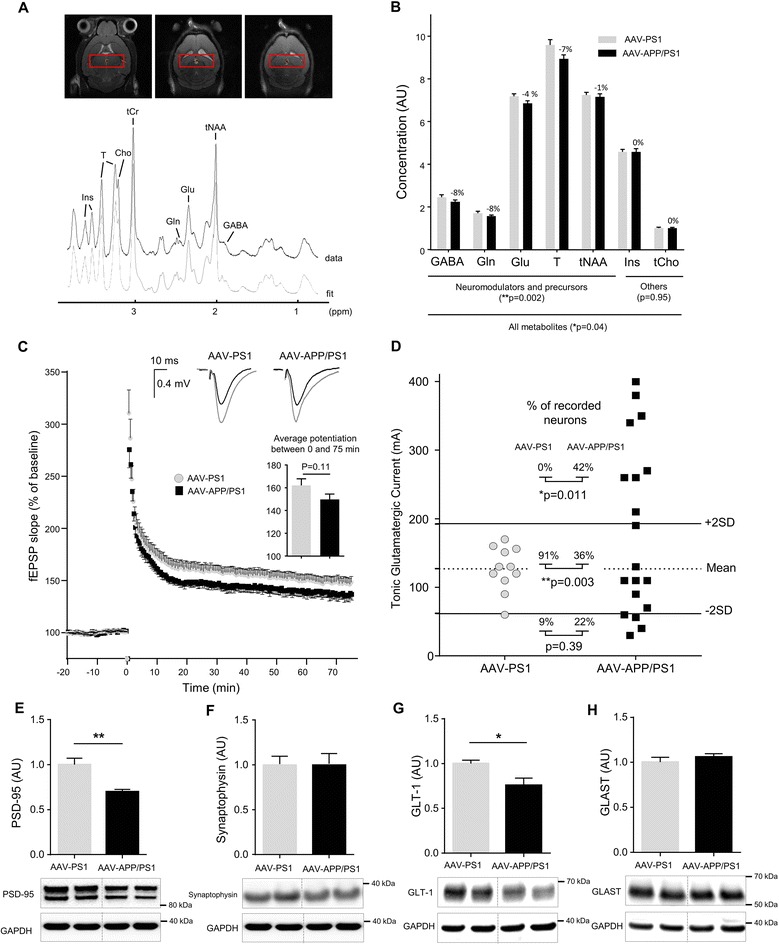
Fig. 5.

AAV-APP/PS1 mice present synaptic defects, 3 months after injection. C57Bl/6 J mice (all males) were injected at 8 weeks of age either with AAV-CAG-PS1M146L (AAV-PS1 mice used as an injected control group, n = 10) or AAV-CAG-APPSL + AAV-CAG-PS1M146L (AAV-APP/PS1 mice, n = 10). Mice were used for in-vivo (a-b) and ex-vivo (c-d) recording three months later. a Top panel: localization of the spectroscopic volume of 7.2 mm x 2 mm x 2.6 mm encompassing both. Hippocampi of each mouse. Bottom panel: representative 1H-MR spectrum acquired from the hippocampus of a mouse 3 months after injection. b Concentrations of seven metabolites were determined from spectra: GABA, Gln, Glu, T, tNAA, Ins and tCho. Macromolecules and lipids were not included in the study and the values obtained were expressed as ratios relative to tCr (n = 10-11 per group). Bars represent means ± SEM. Statistical analysis was performed by two-way ANOVA with experimental group and metabolites as effects. Note that metabolite levels were significantly lower in AAV-APP/PS1 mice (experimental group effect: p = 0.04). A selective analysis of metabolites linked to neuromodulation and precursors (GABA, Gln, Glu, T, tNAA) increased the significance of the difference between both groups (experimental group effect: p = 0.002). c Long-term potentiation (LTP) over 75 min induced by high-frequency stimulation. The inset graphs represent for each group an example of unit field excitatory postsynaptic potentials (fEPSP) before (black line) and after (gray line) LTP induction. The inset histogram shows average potentiation. Bars represent means ± SEM (n = 15-16 slices from n = 10 mice per group). Statistical analysis was performed with Student’s t-test. d Scatter diagram showing the tonic glutamatergic current recorded at a holding potential of +40 mV (whole cell patch-clamp of CA1 pyramidal cells, n = 11-19/group from n = 10 mice per group). Normal response was characterized in a range comprised between AAV-PS1 mean +/- 2SD. Analysis of AAV-APP/PS1 profile revealed a decrease of number of neurons with normal response (Chi2 test: p = 0.003) in association with an increase of neurons with an high level of Tonic glutamatergic current (Chi2 test: p = 0.011) suggesting this current was stronger in the AAV-APP/PS1 group. e-h Western blot analysis of PSD-95, Synaptophysin, GLT-1 and GLAST. Bars represent means ± SEM and data were normalized with respect to GAPDH. Student’s t-test was used for statistical analysis: *p < 0.05
