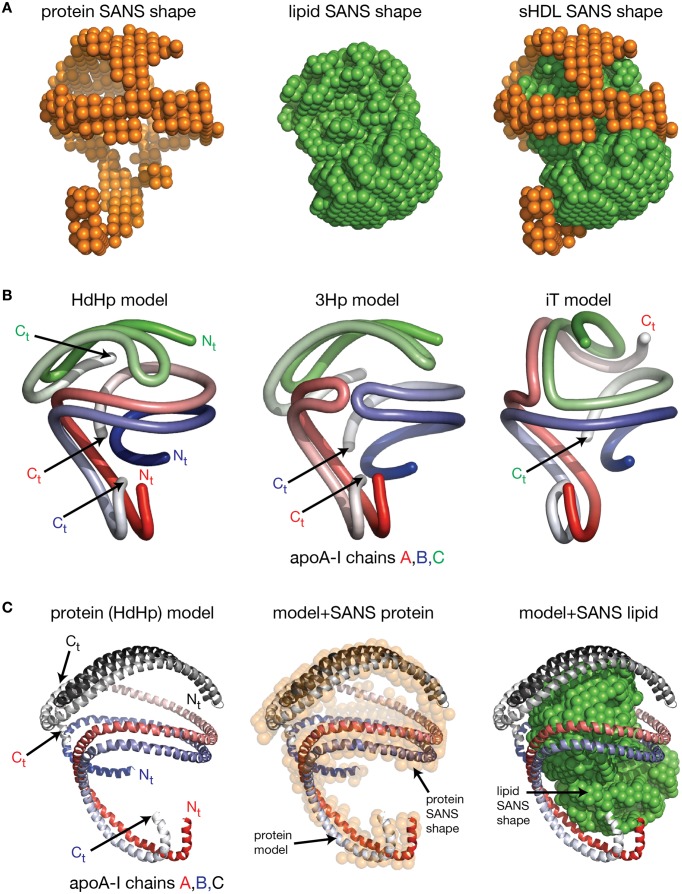
Figure 8.
The low resolution structure and models of sHDL. (A) Left: The low resolution structure of the protein component of sHDL obtained from SANS with contrast variation. Middle: The low resolution structure of the lipid component of sHDL. Right: The low resolution structure of sHDL as a composite of the low resolution structures of the protein and lipid components of sHDL. (B) Schematic representation of the three apoA-I chains in three hypothetical models of sHDL proposed by Wu et al. (2011): HdHp, 3Hp, and iT. Tubes colored with gradient red, blue and green are used to represent the protein chains. Left: The HdHp model of sHDL. Middle: The 3Hp model of sHDL; the locations of Ct of chains A and B are interchanged with respect to the HdHp model. Right: The iT model of sHDL; the locations of Ct of chains A and C are interchanged with respect to the HdHp model. (C) Left: The HdHp model of the apoA-I trimer in sHDL. The apoA-I chains shown in cartoon representation are colored with gradient red/blue/gray. The chains in the AB dimer are oriented antiparallel in helix 5 registry. The chain C is folded into a hairpin and interacts for the AB dimer in specific regions of apoA-I. Right: Superposition of the protein model (HdHp) and the lipid low resolution structure. The authors have not proposed a model for the lipid component of sHDL.

