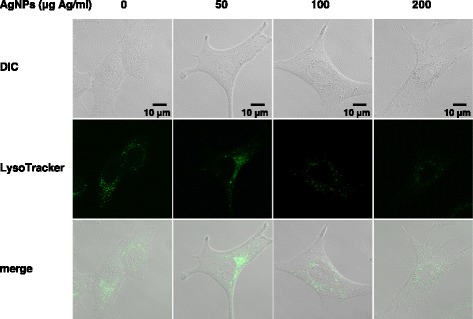
Fig. 3.

Colocalization of AgNPs with lysosomes and perturbation of lysosomes. A549 cells were exposed to AgNPs (50–200 μg Ag/ml) for 24 h and incubated with LysoTracker for 30 min. The lysosomes of cells were visualized by confocal laser microscopy with LysoTracker staining (green signal). Differential interference contrast (DIC) and fluorescence images were merged (merge). Scale bar, 10 μm
