
Fig. 13.
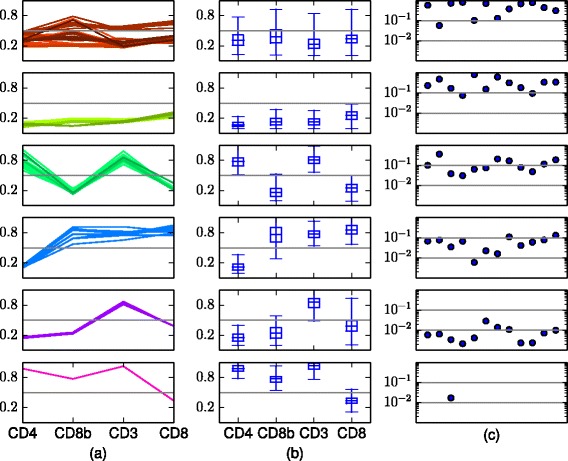
Summary statistics of the six cell populations obtained by BayesFlow (run 2) in the dataset GvHD. The outlier component has at most 0.0019 of the cells in a sample. a Each panel displays the locations μ jk of all mixture components that represent the population, across all samples. Different shades of a color represent different latent components k. b Box plots of the soft clusters in the pooled data. The boxes go between the quantiles q km,0.25 and q km,0.75, the whiskers extend to q km,0.01 and q km,0.99. The α-quantile for (merged) component k in dimension m, q km,α, is here defined as . c Population proportions in each of the twelve flow cytometry samples