Fig. 2.

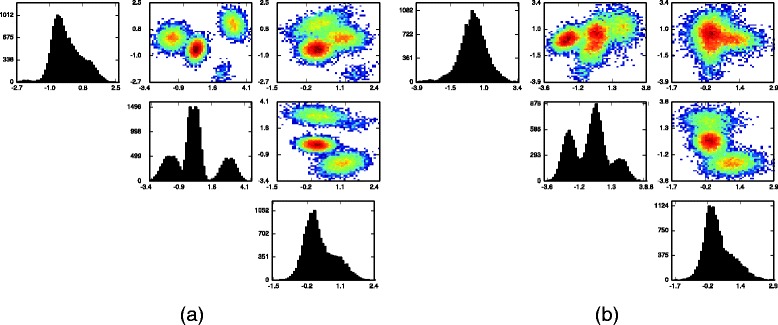
a One and two dimensional histograms for one synthetic flow cytometry sample containing 15,000 data points; b histograms of 15,000 data points drawn uniformly from the pooled data from the synthetic data experiment

a One and two dimensional histograms for one synthetic flow cytometry sample containing 15,000 data points; b histograms of 15,000 data points drawn uniformly from the pooled data from the synthetic data experiment