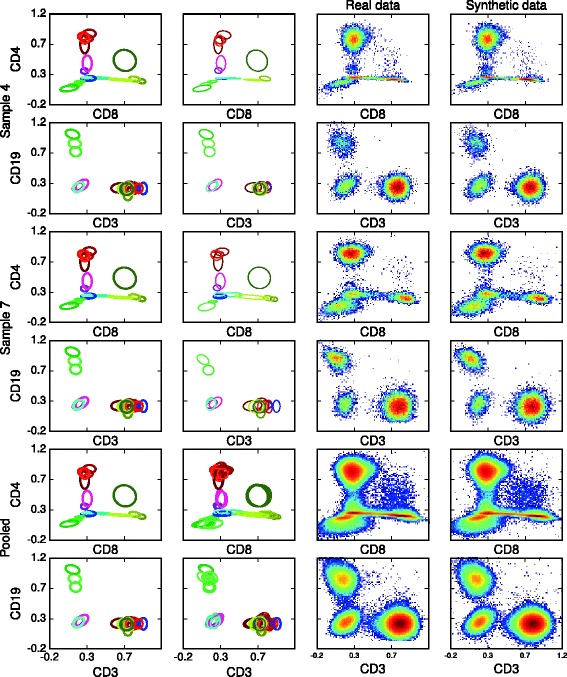
Fig. 4.

BayesFlow component parameter representations of inferred latent clusters (first column) and mixture components (second column) together with histograms of real data (third column) and synthetic data generated from the model (fourth column) for healthyFlowData. The center of each ellipse is the mean and each semi-axis is an eigenvector with length given by the corresponding eigenvalue of the projected covariance matrix. For the latent clusters the parameters are shown, for the mixture components the parameters (μ jk,Σ jk) are shown. Each component or cluster is depicted with the same color as in Fig. 5; different shades of same color corresponds to latent clusters that have been merged
