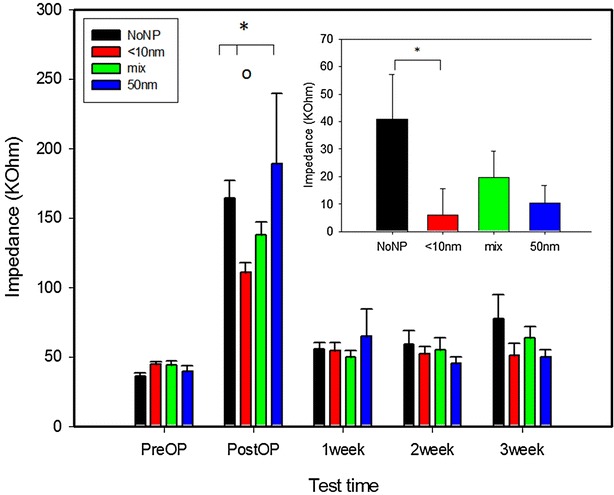
Fig. 4.

Impedance dynamics of electrodes coated with different nanoparticle sizes (<10 nm; 50 nm; mixture of both) and the uncoated group (NoNP) measured in vitro, 10 days postoperatively and after each of the three stimulation weeks (in vivo). Data are given as means + SEM. Significant difference between groups is indicated with (asterisks), while the circle (o) shows a significant effect between different test times (ANOVA with post hoc Tukey’s test p < 0.05). Inserted graph shows comparison of absolute impedance increase before operation and after the 3rd week of stimulation. Significant difference is indicated with asterisk (*; t test p < 0.05)
