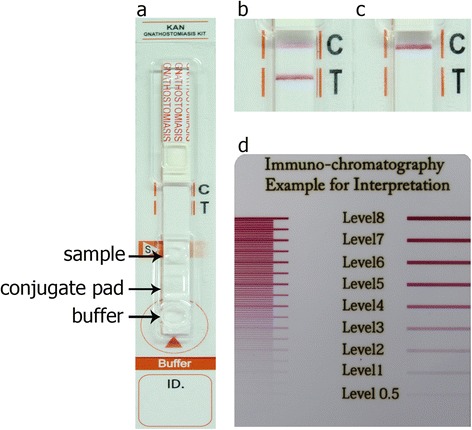
Fig. 1.

The KAN gnathostomiasis kit (a) with immunochromatographic assay for the diagnosis of human gnathostomiasis. Representative images of ICT strips on which positive (b) and negative (c) results are shown. Each diluted serum sample was dropped onto the inscription “sample”, and a buffer was applied onto inscription “buffer”. A criterion of the diagnostic result is whether a red band appears at the test (T) line within 15 minutes or not. In the positive serum sample, the test (T) line and control (C) line turned red (b) but in the negative serum sample, only the control (C) line turned red (c). The intensity of the bands was estimated visually (unaided) according to the reference board (d considering level 2 as the cutoff level)
