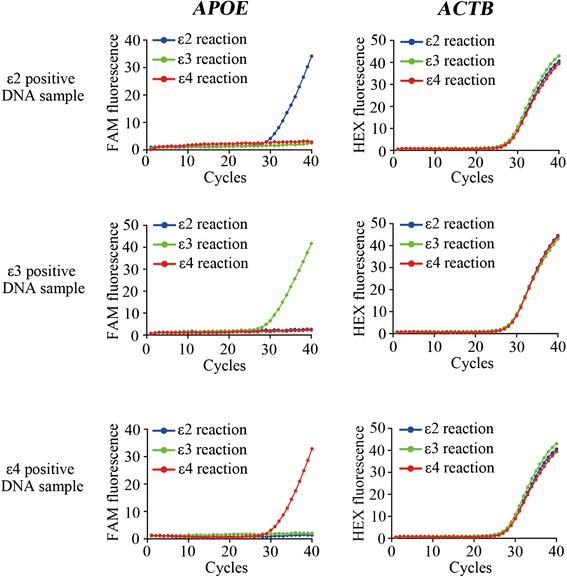
Fig. 2.

APOE genotyping on ε2-, ε3- or ε4-positive plasmid DNA by Real Time PCR. Representative amplification curves for APOE and ACTB are shown. 12000 copies of each plasmid DNA are used as templates. Blue: ε2 reaction; Green: ε3 reaction; Red: ε4 reaction. FAM fluorescence: APOE gene; HEX fluorescence: ACTB gene
