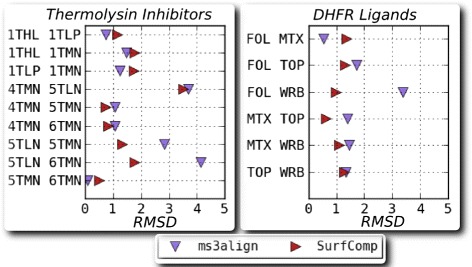
Fig. 12.

Plot of the RMS distance between ligand surfaces after alignment using MS3ALIGN and SURFCOMP. (left) Plot for the dataset of thermolysin inhibitor ligands. The ligands are identified by the PDB they were extracted from. (right) Plot for the dataset of ligands bound to DHFR enzymes. The ligands are identified by their abbreviation
