Fig. 7.

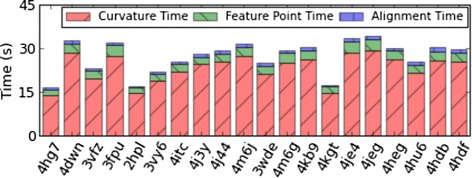
Stacked bar graph showing breakup of MS3ALIGN run-times for the surfaces used in the partial overlap study. The time taken for alignment (stages iii−v) is significantly lesser than time taken for the first and second stage

Stacked bar graph showing breakup of MS3ALIGN run-times for the surfaces used in the partial overlap study. The time taken for alignment (stages iii−v) is significantly lesser than time taken for the first and second stage