
Fig. 1.
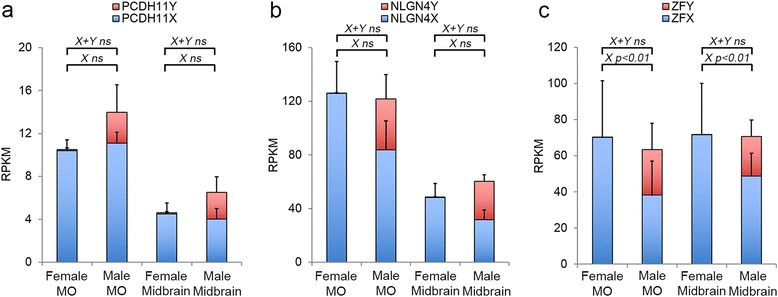
Quantification of expression levels using RNA sequencing. Staple bars show the average RPKM for both total RNA and polyA+ sequencing of female and male MO and midbrain for PCDH11X/Y (a), NLGN4X/Y (b) and ZFX/Y (c). Only ZFX showed significant expression differences between females and males in both tissues, and NLGN4X presented a non-significant increase in females