Fig. 6.

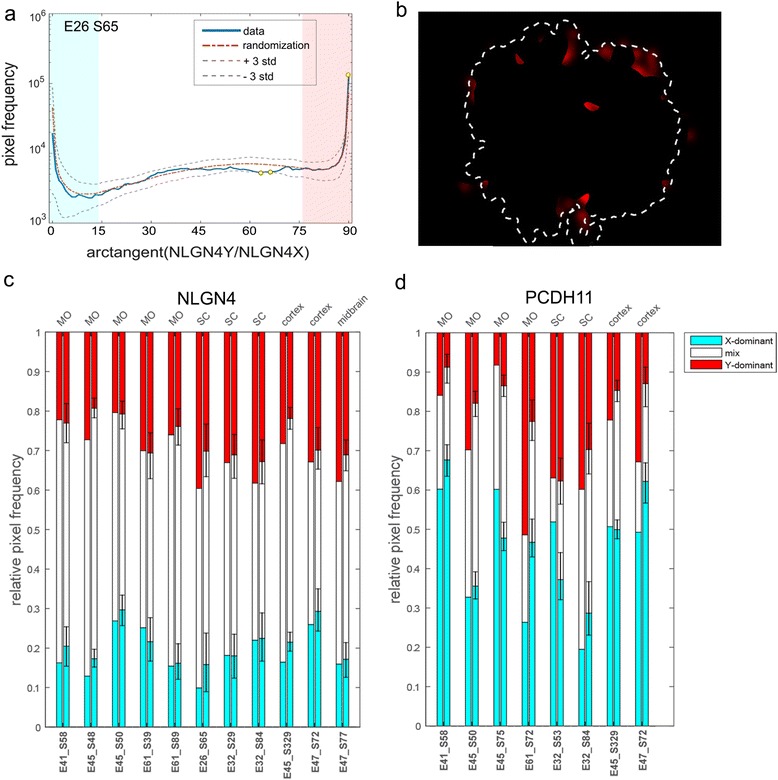
Comparison of the observed spatial signal distribution to randomized signal distributions in male MO for NLGN4X/Y. The frequency of pixels of varying intensity ratios of X and Y for NLGN4X/Y in male SC (E32_S84) are displayed in the histogram in a. A cutoff of 80 % colour purity was set to classify pixels as X dominant and Y dominant, displayed in the histogram as a blue field and a pink field, respectively. Pixels deviating more than 3 SD are shown as yellow dots on the blue line and then plotted in b visualize the location of the pixels over-represented in the sample tissue compared to the randomized data set. The proportions of X-dominant, Y-dominant and mixed pixels in the analysed samples are shown for all samples next to their respective randomized data set in c for NLGN4X/Y and in d for PCDH11X/Y. Relative pixel frequency from the random distributions for all samples is shown in c and d.
