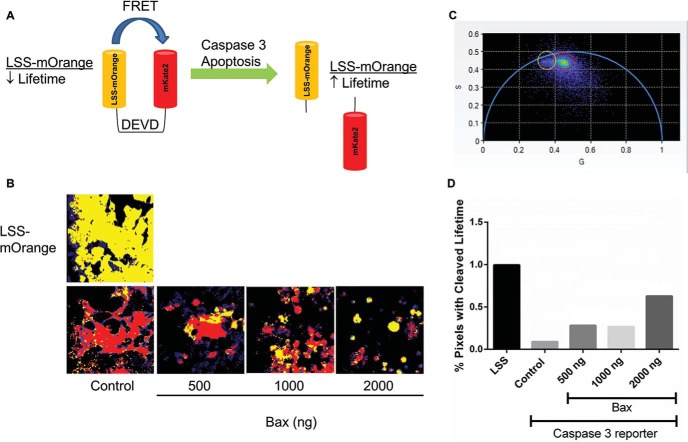
Figure 1.
Validation of caspase-3 reporter activity. (A) Schematic of FRET with the caspase-3 reporter. Intact LSS-mOrange-DEVD-mKate2 produces a shorter fluorescence lifetime of LSS-mOrange, whereas cleavage at the DEVD site in the reporter prolongs the fluorescence lifetime of LSS-mOrange. (B) Representative images of 293T cells transiently transfected with control (LSS-mOrange) or functional caspase-3 reporter plus increasing concentrations of a plasmid for Bax. Control cells were cotransfected with the highest amount of empty vector. Representative images are shown 24 hours after transfection with pixels pseudo-colored in red or yellow corresponding to shorter or longer fluorescence lifetimes, respectively. Pixels not highlighted in red or yellow correspond to autofluorescence. (C) Each image pixel is represented as an individual coordinate in the phasor plot, where coordinates nearer to the origin have a longer lifetime. The red region of interest represents the shorter intact reporter lifetime, and the yellow region of interest represents the longer cleaved reporter lifetime. (D) Graph shows the percentages of cleaved reporter (yellow in panel C) in each representative image. The bar for each condition defines aggregate pixels from multiple cells within a single image field, with lifetimes corresponding to fluorescence from the cleaved reporter, which accounts for absence of error bars.

