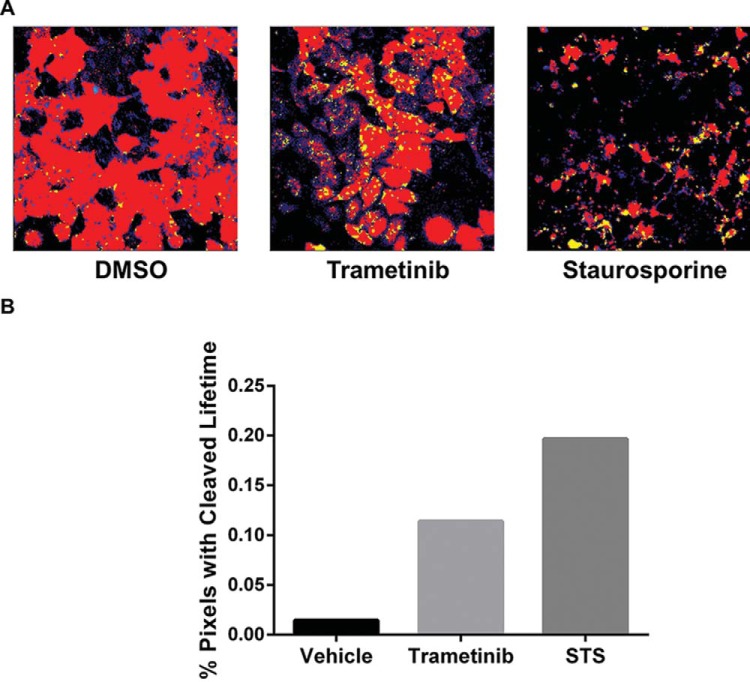
Figure 2.
Trametinib activates caspase-3 in MDA-MB-231 cells. (A) Representative images of stable MDA-MB-231 reporter cells treated overnight with 10 nM trametinib, 1 μM staurosporine (positive control), or vehicle control. Fluorescence lifetimes in each pixel are pseudo-colored red or yellow corresponding to intact or cleaved reporters, respectively. (B) Graph shows the percentages of highlighted pixels in each representative image with fluorescence lifetimes of LSS-mOrange corresponding with caspase-3 cleavage of the reporter. The bar for each condition defines aggregate pixels from multiple cells within a single image field with lifetimes corresponding to fluorescence from the cleaved reporter, which accounts for absence of error bars.

