Figure 5.
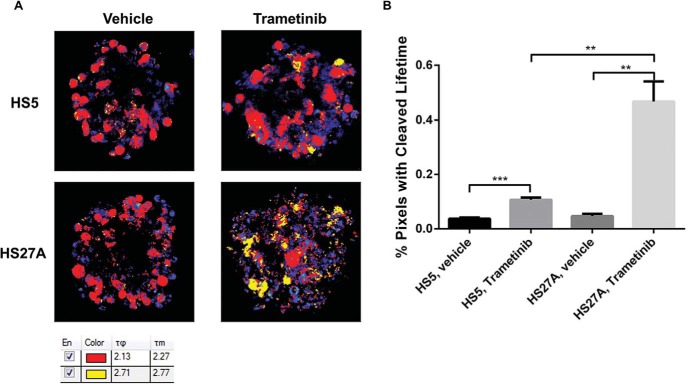
Bone marrow stromal cells in 3D culture differentially regulate the activation of caspase-3 in MDA-MB-231 cells. (A) Representative images of spheroids composed of MDA-MB-231 reporter cells with HS5 or HS27A bone marrow stromal cells treated overnight with 1 μM trametinib or vehicle control. Shorter and longer fluorescence lifetimes are depicted as red and yellow pixels, respectively. Pixels not highlighted correspond to autofluorescence and are pseudo-colored on a scale by counts. The table shows pixels corresponding to intact and cleaved caspase-3 reporter highlighted as red and yellow, respectively. τφ and τm define phase and modulation lifetimes from phasor analyses of FLIM data. (B) Graph shows mean values + SEMs (n = 4-5 per condition) of the percentages of pixels with the fluorescence lifetime of unfused LSS-mOrange after caspase-3 cleavage (**P < .01, ***P < .001).

