
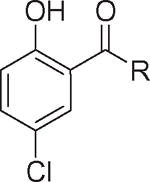
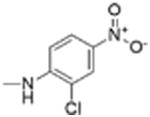
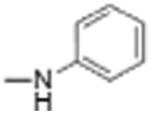
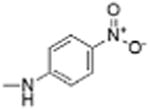
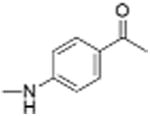
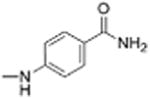
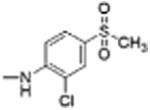
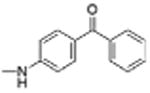
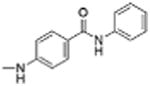
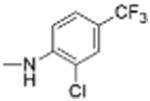
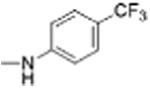
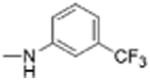
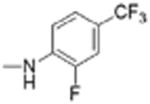
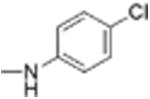
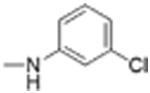
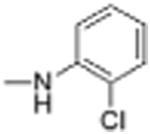
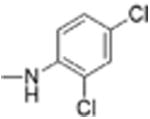
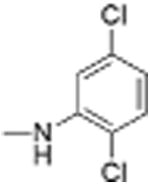
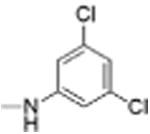
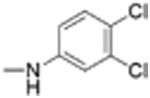
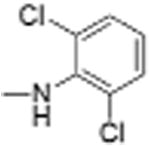
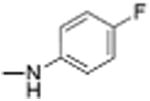
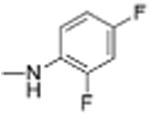
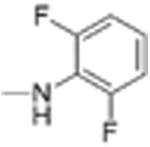
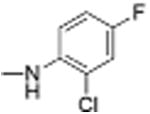
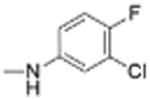
Table 1. Structure–activity relationships in the anilide ring.
| |||||
|---|---|---|---|---|---|
|
| |||||
| Compound number | Structure R | Fzd1-GFP Internalization @12.5 μMa | Inhibition Wnt/β-catenin transcription TopFlash IC50 (μM) ± SE | ClogP | pKa NHb |
| 1 |
|
5 | 0.34 ± 0.08 | 3.1 | 11.2 |
| 2 |
|
0 | 11.81 | 3.3 | 13.2 |
| 3 |
|
5 | 0.99 ± 0.32 | 2.7 | 12.1 |
| 4 |
|
0 | 6.42 ± 0.51 | 3.0 | 12.5 |
| 5 |
|
0 | >12 | 1.9 | 12.7 |
| 6 |
|
0 | 7.66 | 2.6 | 11.4 |
| 7 |
|
0 | 15.04 | 4.2 | 12.5 |
| 8 |
|
0 | 32.89 | 4.1 | 12.6 |
| 9 |
|
5 | 0.56 ± 0.21 | 4.8 | 11.9 |
| 10 |
|
5 | 0.29 ± 0.06 | 4.5 | 12.4 |
| 11 |
|
5 | 0.89 ± 0.32 | 4.7 | 12.5 |
| 12 |
|
5 | 0.55 ± 0.11 | 4.5 | 11.8 |
| 13 |
|
3 | 1.30 ± 0.18 | 4.0 | 12.8 |
| 14 |
|
5 | 1.65 ±0.12 | 4.0 | 12.6 |
| 15 |
|
1 | 3.05 ± 0.87 | 3.9 | 12.3 |
| 16 |
|
5 | 0.42 ± 0.10 | 4.5 | 11.9 |
| 17 |
|
5 | 0.75 ± 0.13 | 4.4 | 11.7 |
| 18 |
|
5 | 0.70 ± 0.13 | 4.5 | 12.0 |
| 19 |
|
5 | 0.73 ± 0.13 | 4.5 | 12.2 |
| 20 |
|
0 | >12 | 4.3 | 11.4 |
| 21 |
|
0 | 3.84 ± 0.29 | 3.9 | 13.1 |
| 22 |
|
2 | 4.02 ± 0.79 | 4.0 | 12.6 |
| 23 |
|
ND | >12 | 3.9 | 12.1 |
| 24 |
|
3 | 1.41 ± 0.21 | 4.4 | 12.2 |
| 25 |
|
5 | 1.21 ± 0.17 | 4.4 | 12.5 |
Internalization of Frizzled1-GFP stably expressed in U2OS cells was determined by confocal microscopy. Cells were treated with compounds for 6 h, fixed, and scored visually by the amount of punctate observed versus DMSO control. Inhibition of Wnt3A-stimulated Wnt/β-catenin transcription was determined by TOPFlash normalized to renilla control. ClogP and pKa values were calculated in Maestro 9.3 (Schrodinger, Inc.) using Qikprops and Epik.
Punctate similar to control = 0, trace amount of punctate greater than control = 1, moderate = 3, strong = 5.
Calculated pKa values in water are reported. The calculated value of the pKa of the –OH group is 6.8 in each example listed. The calculated pKa of the NH is the salicylamide NH without ionization of the –OH group. The estimated error of the pKa calculation for the OH group is ±1 log unit, and ±2 for the NH group. ND: not determined.