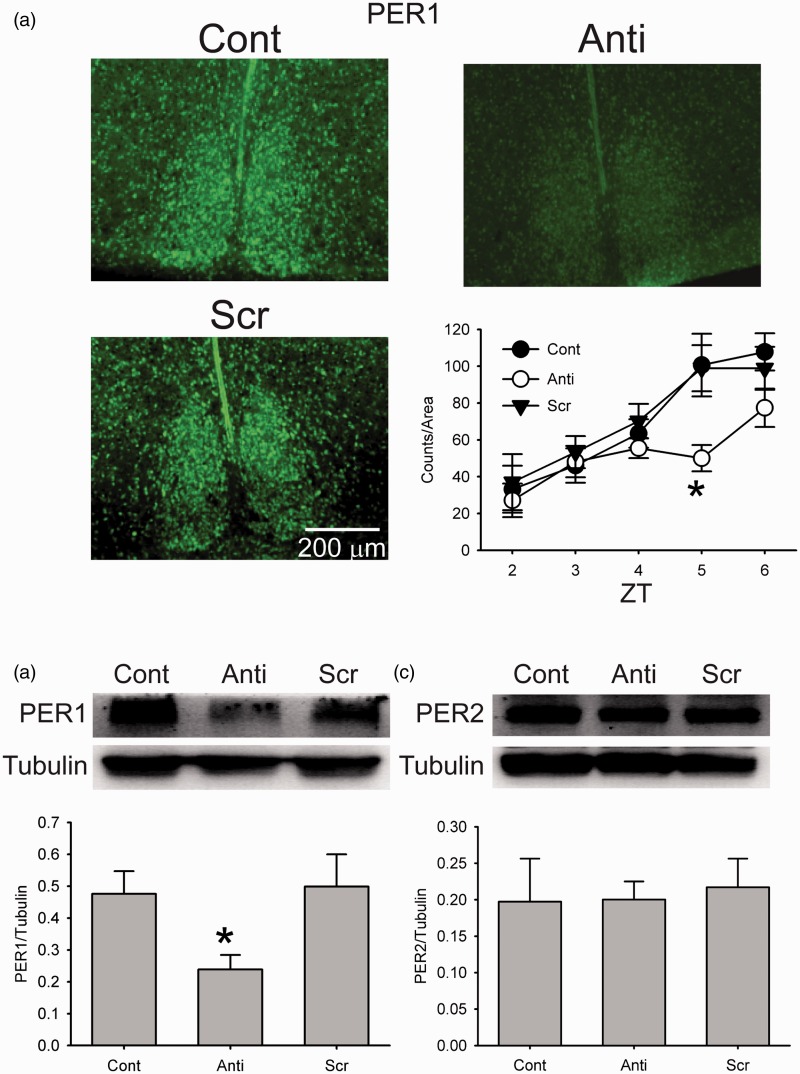
Figure 1.
Antisense ODN for Per1 reduced PER1 expression in the SCN. (a) Photomicrographs illustrate that the application of antisense ODN for Per1 (10 µM) reduces PER1 expression as measured by immunohistochemistry (IHC). Cont: control, Anti: antisense ODN for Per1, and Scr: scrambled ODN. Bottom right, bar graphs show PER1 positive cell counts for Cont, Anti, and Scr (±SE, n = 3 for each time point). *Significant difference (p < .05) analyzed by two-way ANOVA followed by Holm-Sidak method for multiple comparisons (vs. Cont). ZT = Zeitgeber time. (b) Example of Western blots measuring PER1 expression in the SCN tissue. Tubulin protein expression was measured as a control for loading. Bottom: Levels of PER1 protein expression (+SE, normalized to tubulin, n = 3 for each group). *Significant difference (p < .05) analyzed by one-way ANOVA followed by Holm-Sidak method for multiple comparisons (vs. Cont). (c) Example of Western blots measuring PER2 expression in the SCN tissue. Tubulin protein expression was measured as a control for loading. Bottom: Levels of PER2 protein expression (+SE, normalized to tubulin, n = 3 for each group).

