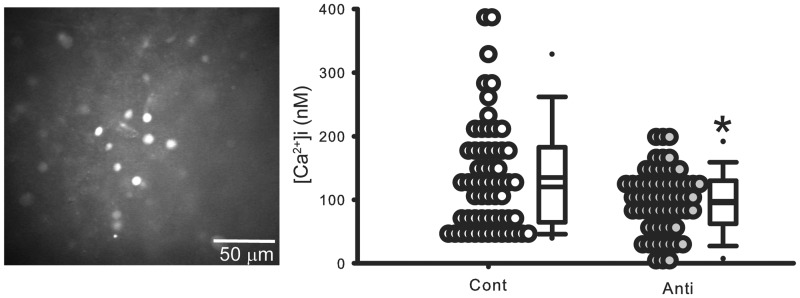
Figure 3.
Antisense ODN for Per1 reduced [Ca2+]i levels in cells in the SCN during daytime. In these experiments, resting [Ca2+]i levels were estimated in SCN neurons in brain slices with antisense ODN for Per1 and compared with data obtained from the control group. Animals were sacrificed at ZT 0. Each cell is sampled only once. Left: Representative pictures in Fura2 imaging in the SCN. Right: Dot density plot showing that [Ca2+]i levels in SCN cells were reduced by antisense ODN for Per1. Cont: control, Anti: antisense ODN for Per1. *Significant difference (p < .05) analyzed by unpaired Student’s t-test. Bottom: Histograms illustrating the distribution of [Ca2+]I levels. For each group (±SE), n = 59 cells from four mice.

