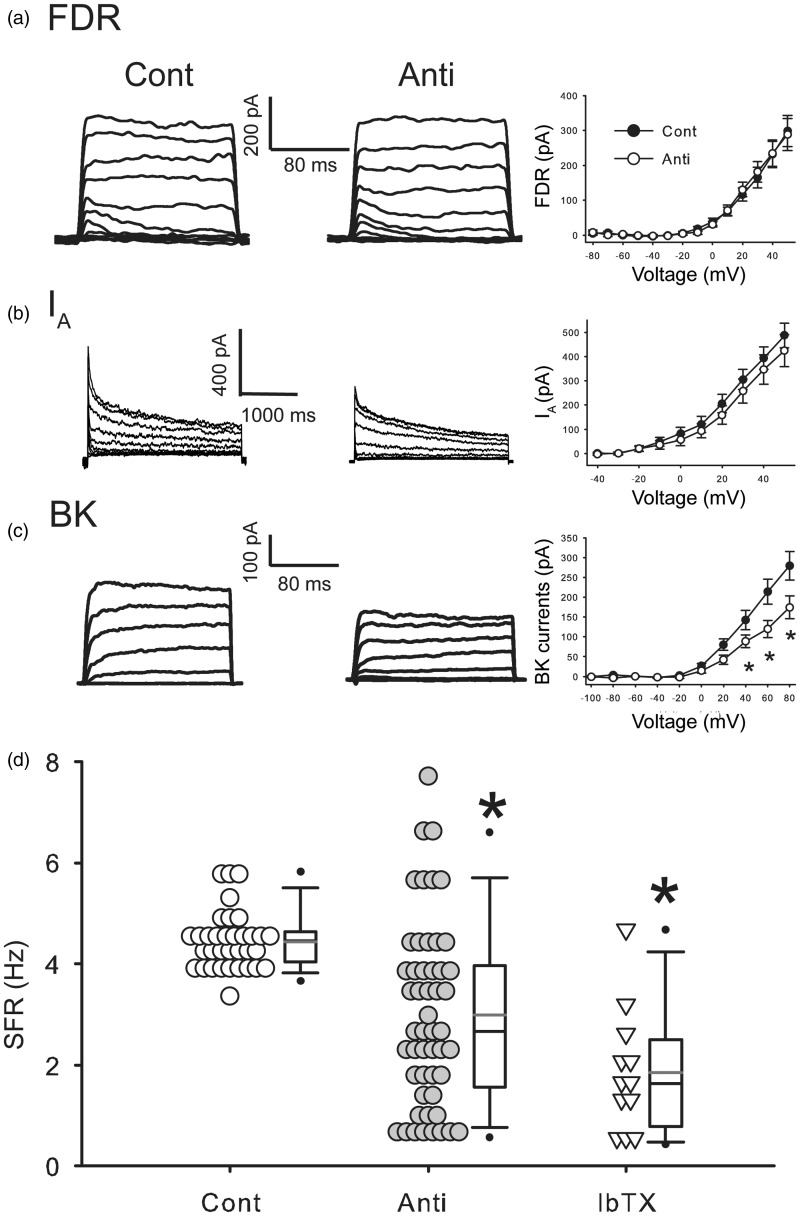
Figure 4.
Antisense ODN for Per1 reduced BK currents in the SCN during daytime. (a) Left, representative examples showing that application of antisense ODN for Per1 (10 µM) did not decrease the magnitude of fast delayed rectifier (FDR) currents in the SCN neurons. Right, current-voltage (I–V) relationship of FDR currents in SCN neurons. Cont: control, Anti: antisense ODN for Per1. For each group (±SE), n = 20 cells from 10 mice. (b) Left, representative examples showing the IA currents. Right, I–V curve of IA measured in SCN neurons. For each group (±SE), n = 11–15 cells from 4 to 13 mice. (c) Left, representative examples showing BK currents. Right, I–V curve of BK current measured in SCN neurons. *Significant difference (p < .05) analyzed by two-way repeated measures ANOVA followed by Holm-Sidak method for multiple comparisons (vs. Cont). For each group (±SE), n = 20–21 cells from 15 to 18 mice. (d) Average firing rate of control, antisense ODN for Per1, and iberiotoxin (IbTX). *Significant difference (p < .05) analyzed by one-way ANOVA followed by Dunn’s method for multiple comparisons (vs. Cont). For each group n = 12–51 cells from 6 to 8 mice. Cont and Anti data are the same as Figure 2(b). The currents were normalized by capacitance.

