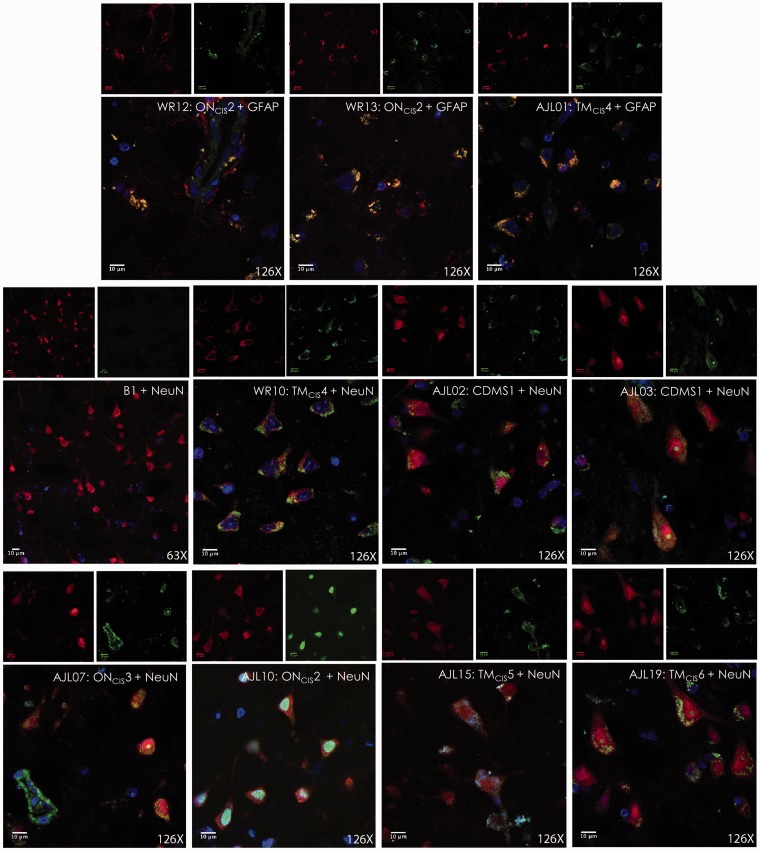
Figure 7.
IFC of AGS+ rhAbs targeting neurons and astrocytes in GM brain tissue from an MS patient. IFC images are shown at 126× magnification of fixed GM brain tissue from an MS patient. The primary rhAb is shown in green in all overlay panels. The 10 AGS+ rhAbs and the negative control rhAb (B1) are shown. The upper row of three overlay panels include the colocalization marker, GFAP (for astrocytes) shown in red, and the lower rows of eight overlay panels include the colocalization marker, NeuN (for neuronal nuclei) shown in red. The independent red and green channel images are located above each overlay and include the nuclear 4′,6-diamidino-2-phenylindole counterstain. The rhAb designation, patient type, patient number and counter-stain antibody (NeuN or GFAP) are shown in the upper right corner of all figure overlays. IFC data are representative of three sections per rhAb. Scale bar represents 100 µm. AGS = antibody gene signature; GM = gray matter; IFC = immunofluorescence; rhAb = recombinant human antibody.

