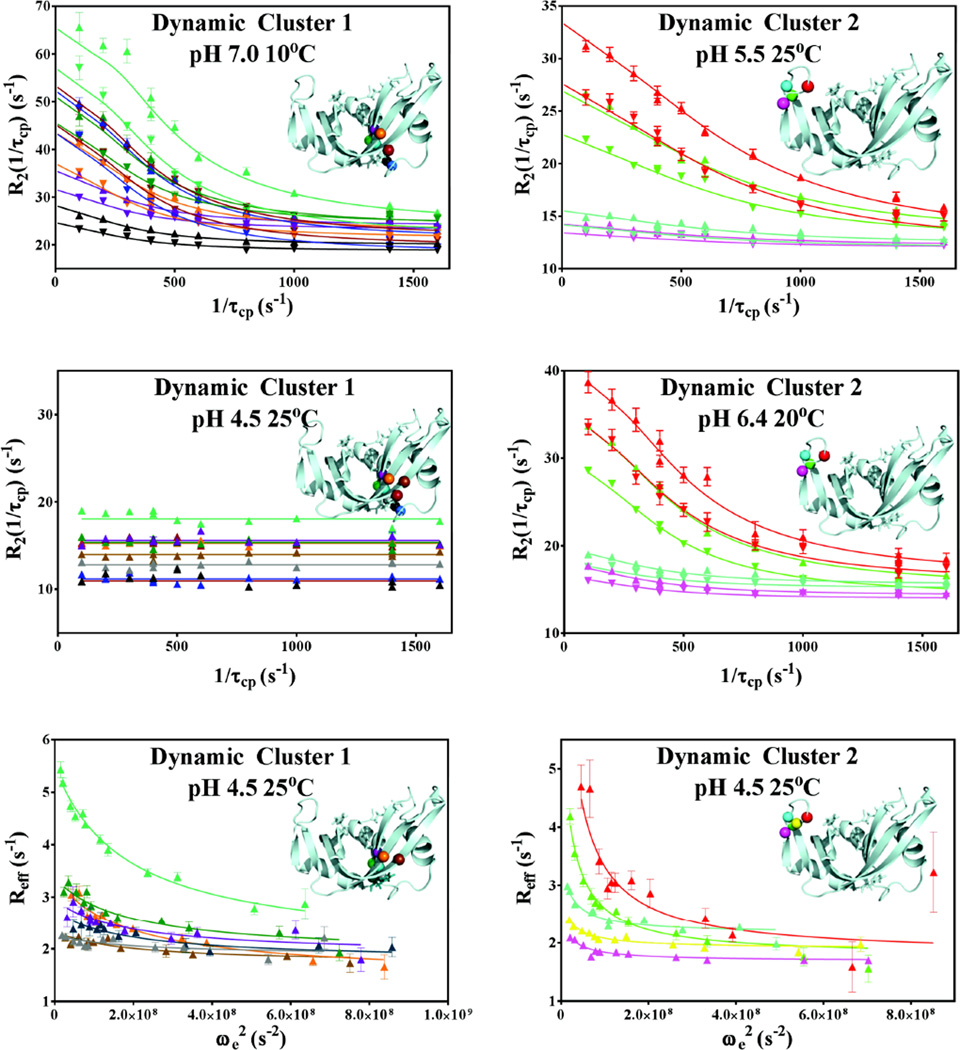
Figure 2.
Representative global fits of relaxation dispersion data. Data collected at 500 and 600 MHz are represented with ▼ and ▲, respectively. Global 2-field CPMG fits of dynamic cluster 1 at 10°C, pH 7.0 and dynamic cluster 2 at 25°C, pH 5.5 and 20°C, pH 6.4 are shown, as well as lack of CPMG-detected dispersion for Cluster 1 at 600 MHz at 25°C, pH 4.5. 600 MHz R1ρ data at 25°C and pH 4.5 of both clusters are shown in the bottom panels. The backbone nitrogen atoms of the residues involved in each global fit are mapped onto the structure in each panel and are color matched to the color of the respective dispersion data. Dynamic cluster 1 residues S15, S16, T17, F46, V47, H48, T82, D83, T100 and Q101 are shown in gray, black, blue, purple, green, dark teal, teal, orange, brown, and dark red, respectively. Dynamic cluster 2 residues A64, C65, K66, T70, and N71 at 25°C and pH 5.5 are shown in fuchsia, yellow, red, cyan, and green, respectively.

