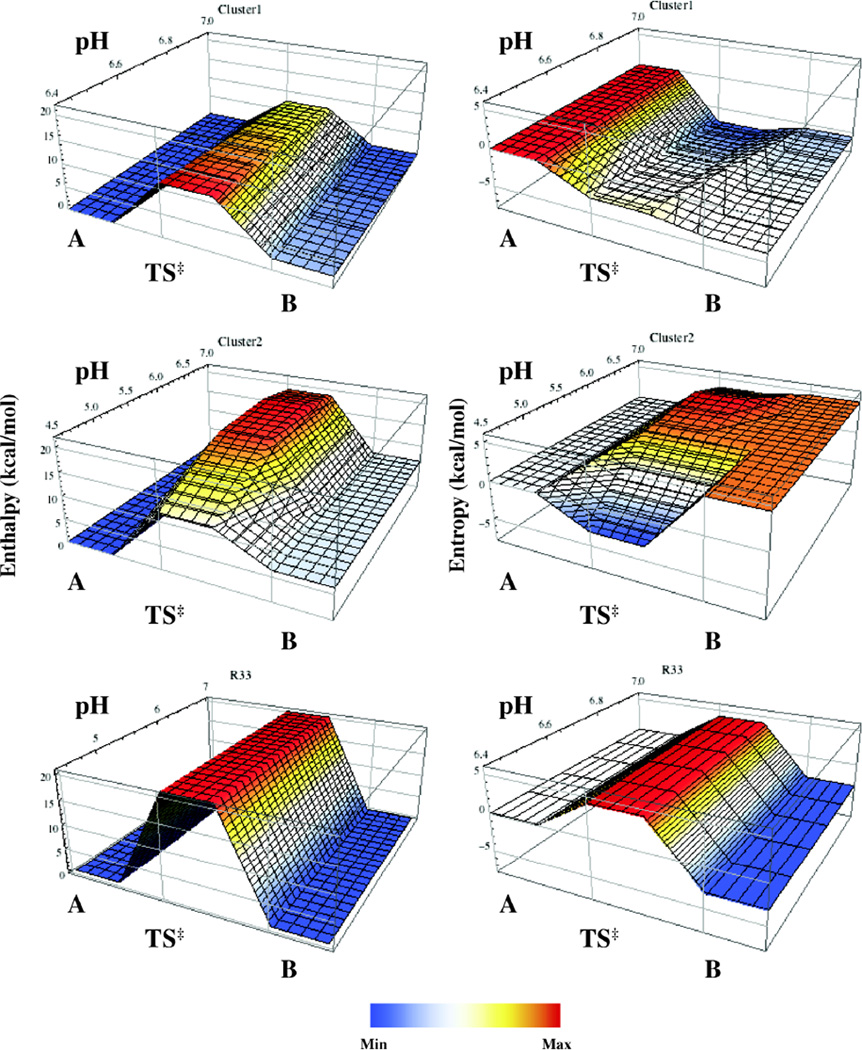
Figure 4.
Energy landscape surfaces for conformational changes (A ⇌ TS† ⇌ B) in RNase A. pH-dependent changes in enthalpy (left) and entropy (right) are depicted for Cluster 1 (top), 2 (middle), and R33 (bottom). Data were obtained from temperature dependent NMR relaxation experiments. In all cases conformation A is set at a reference value of 0 kcal/mol.

