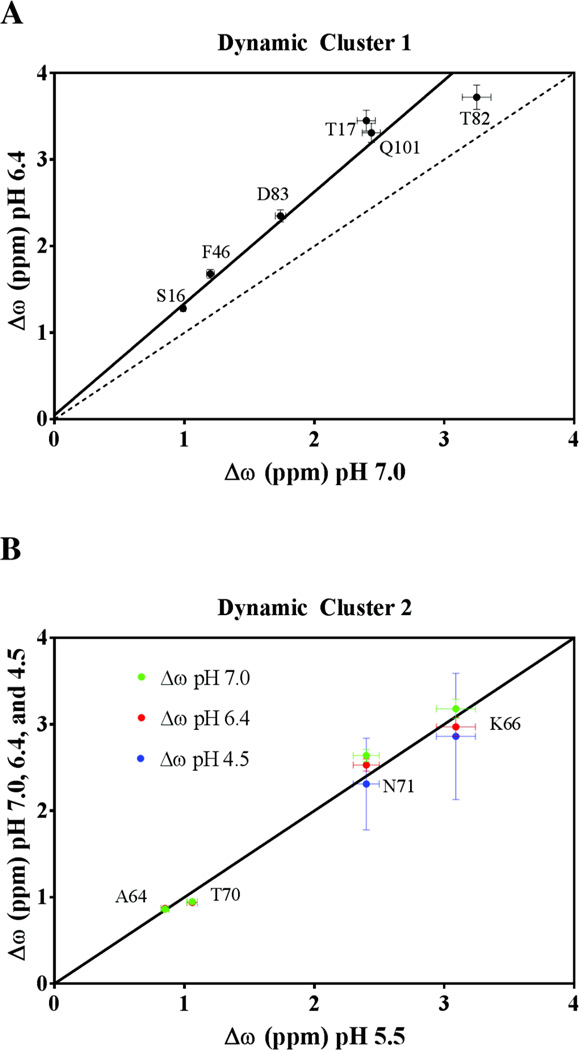
Figure 5.
The dependence of Δω on pH. (Top) Correlation plot of Δω at pH 7.0 vs. Δω pH 6.4 of dynamic cluster 1 residues, S16, T17, F46, T82, D83, and Q101. The dashed line of unit slope shows a weak correlation (R2 = 0.46) with the data at the two values of pH, and is depicted for reference. The data is best described by a line of slope 1.29 ± 0.16 (weighted R2 = 0.97), with near-zero y-intercept, suggesting that the global motion may not be adequately described by a simple two-state model. (Bottom) Correlation plot of Δω at pH 5.5 vs. Δω at pH 7.0 (green), 6.4 (red) and 4.5 (blue) of loop 4 residues A64, K66, T70, and N71. Δω values determined at each of four pH values are well-described by a line of unit slope passing through the origin (R2 > 0.98), suggesting that the two chemical environments being sampled by cluster 2 remain unchanged over the pH range.

