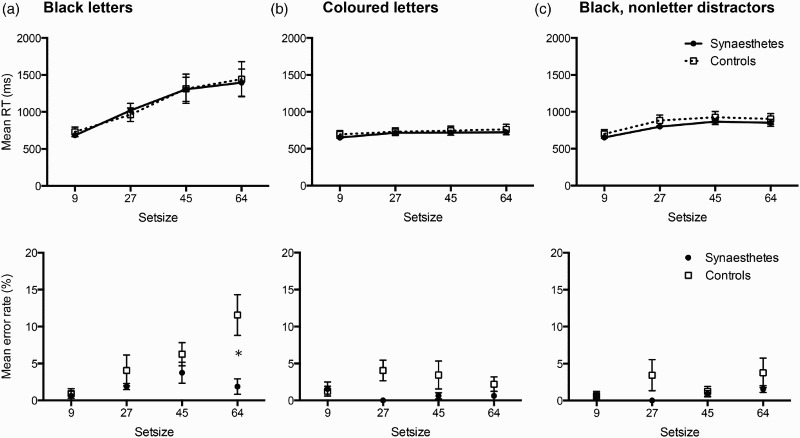
Figure 4.

Group RTs (msec; upper panels) and error rates (%; lower panels) for the modified Embedded Figures Task. Synaesthetes: filled circles; Controls: open squares. (a) Both the letters composing the target triangle and distractor letters were presented in black. Asterisk denotes the significant difference between synaesthete and control errors at setsize 64 (p=.005). (b) The target triangle was composed of a letter in one colour while distractors were a letter in another colour (both congruent for the synaesthete). There was a trend (p=0.066) for synaesthetes to be more accurate than controls. (c) Both the target and distractor items were black, but the distractors were repetitions of a single nonsense symbol. Error bars are standard errors of the mean. Note chance performance would be 50% in this task.
