FIG. 4.
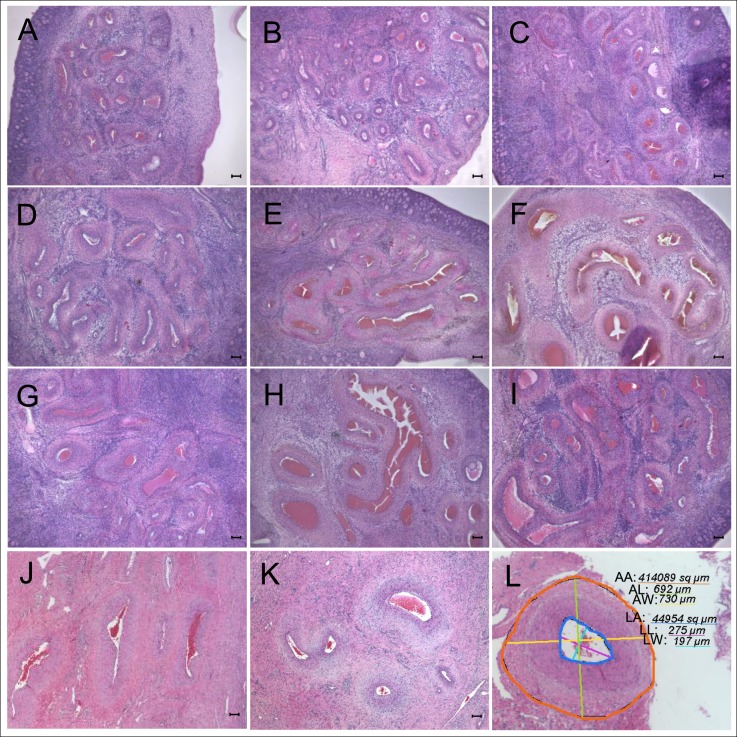
Representative images of the ovarian arteries within the hilum in Fetal Day 140 (d140) and 10-mo-old animals. A–C) Fetal ovaries from untreated mothers (controls). D–F) Fetal ovaries from T-treated mothers. G–I) Fetal ovaries from DHT-treated mothers. Ovarian hilum in control ovaries shows cross sections of ovarian arteries filled with red blood cells (A–C). Ovarian hilum in T- (D–F) and DHT-treated (G–I) groups shows that ovarian arteries in the hilum are larger than in the control group. J–K) The 10-mo-old ovaries from sheep born from control females. L) Arterial tracing of one vessel. Parameters assessed included measurements of arterial area (AA, orange), length (AL, green), and width (AW, yellow), lumen area (LA, dark blue), lumen length (LL, purple), and lumen width (LW. light blue). Numbers in the figure indicate measurement values in μm for diameter or μm2 for area. Each number is underlined by a color line corresponding to the color in the image. Difference between arterial and lumen area provided wall area. Bar = 100 μm. T, testosterone; DHT, dihydrotestosterone.

