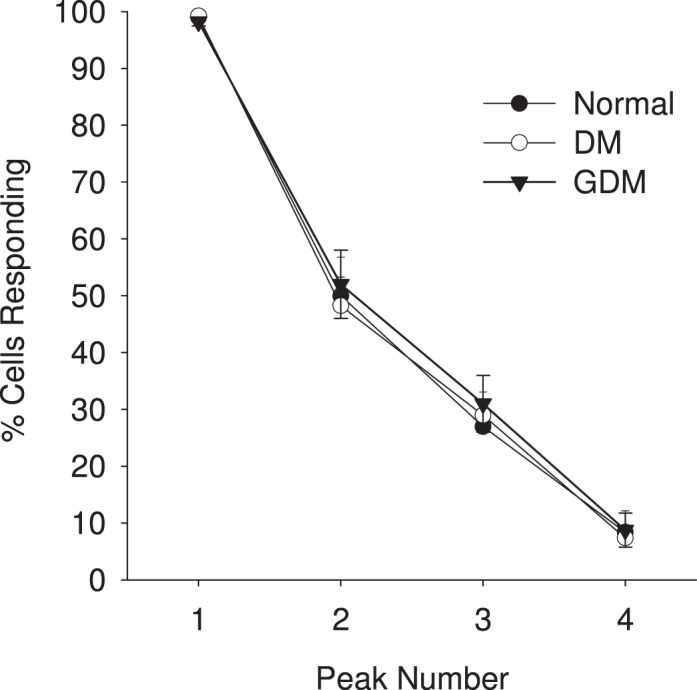
FIG. 2.

Percent (%) of UV endo cells showing each successive burst after stimulation with 100 μM ATP. Vessels from each treatment group as indicated in Figure 1 were assessed for [Ca2+]i bursts and the data plotted as shown for each group. Incidence of [Ca2+]i bursts was determined for 40 or more individual cells per image field. Data are means ± SEM of such analysis of six to nine vein segments per treatment group. Percentage of cells responding in the vessel segment with each successive Ca2+ burst peak are shown. One-way ANOVA was used to analyze the data. No significant differences (P < 0.05) in occurrence of bursts were observed in UV endo from control versus GDM versus DM UV endo, but this does not take into account burst size; see average tracings in Figure 3.
