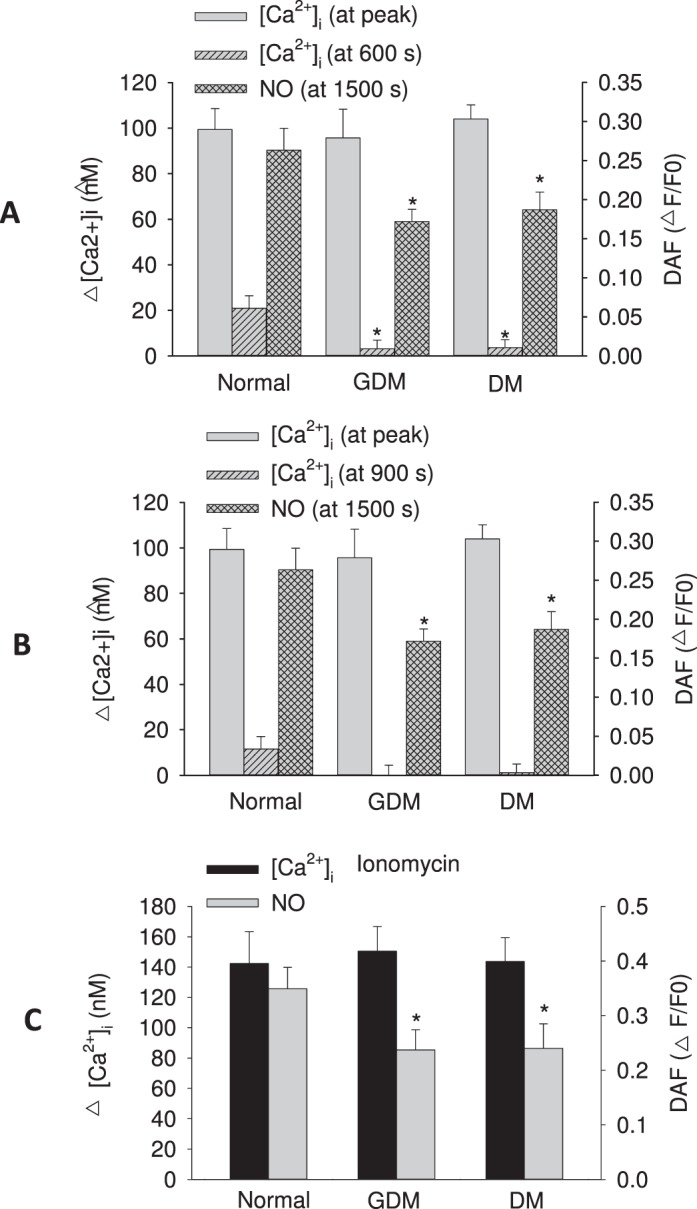
FIG. 4.

Quantification of overall average Ca2+ and NO responses from UV endo (from Fig. 3). Quantification of average ATP (100 μM) stimulated change in [Ca2+]i above basal (basal was typically in the range ∼80–100 nM) measured as the initial peak maximum and the sustained phase [Ca2+]i at 600 sec (A) or 900 sec (B) for all UV endo (control, DM and GDM). Data are shown alongside measures of total NO produced (measured at 1200–1500 sec). For comparison, the response to receptor-independent Ca2+ ionophore (ionomycin 5 μM) stimulation is also shown in C. Data are calculated from the same UV endo data shown in Figure 3 and represent combined means ± SEM of data from six to nine vein segments per group. Student t-test or one-way ANOVA were used to analyze the data as appropriate. In all cases, significant differences from control are indicated (*P < 0.05).
