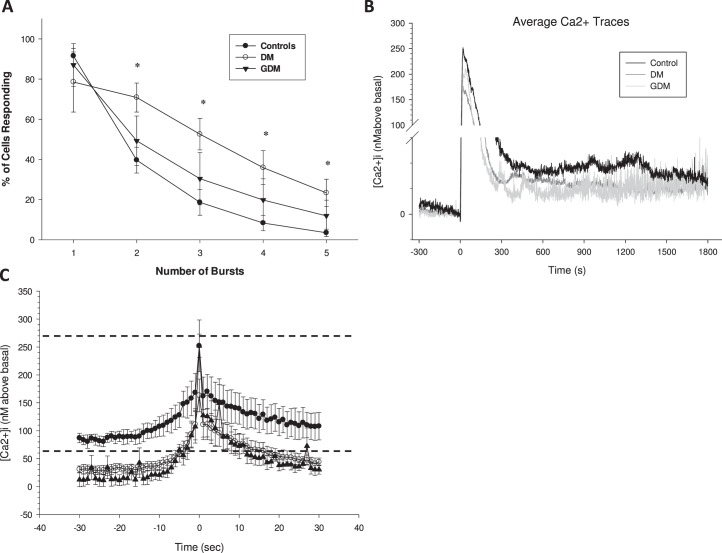
FIG. 7.
Average tracings and Ca2+ burst events from HUVEC cells. For each panel, data were first the average from ∼80 cells per dish on six combined dishes per patient, then these values were combined to give the overall combined mean and SEM for control: n = 5 patients; GDM: n = 4 patients; DM: n = 6 patients. Student t-test or one-way ANOVA were used to analyze the data as appropriate. Significance is as indicated (*P < 0.05). A) The percent of HUVEC showing each successive burst after stimulation with 100 μM ATP is shown for each subject group. B) The overall average tracing of primary HUVEC responses to ATP (100 μM) stimulation are shown, corrected for basal, which was typically in the range 30–65 nM prior to ATP addition. ATP (100 μM) was added at time 0. These results suggest that in spite of increased burst rate, both the initial peak height and the sustained phase average [Ca2+]i are still reduced in GDM and DM subjects. C) The average third burst elevation of Ca2+ above basal (set at 0) for combined cells from each patient donor was calculated over a period of ±30 sec from maximum, and then data from each patient were combined for each treatment group to give mean and SEM as shown. For symbols, key see A. The dashed lines represent the predicted activation range for NOS3 relative to this basal-corrected scale, as predicted by the data of Tran et al. [16].

