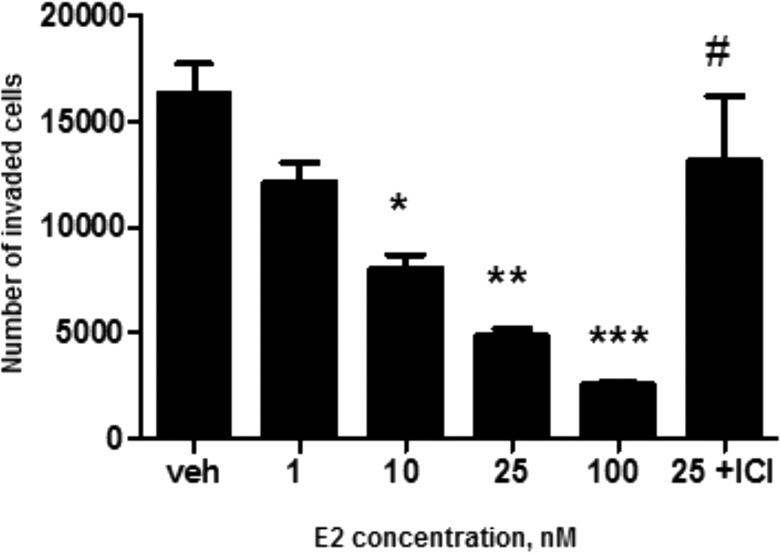
FIG. 4.
The effect of E2 on cell invasion. The indicated concentrations of E2 were tested to study their effect on invasion of HTR-8/SVneo cells. Asterisks denote statistical difference from the vehicle (*P < 0.05, **P < 0.01, ***P < 0.001), and the hash mark denotes statistical difference between 25 nM E2 with and without the antiestrogen ICI 182,780 (#P < 0.05). Bars represent mean ± SEM (n = 3).

