Figure 1.
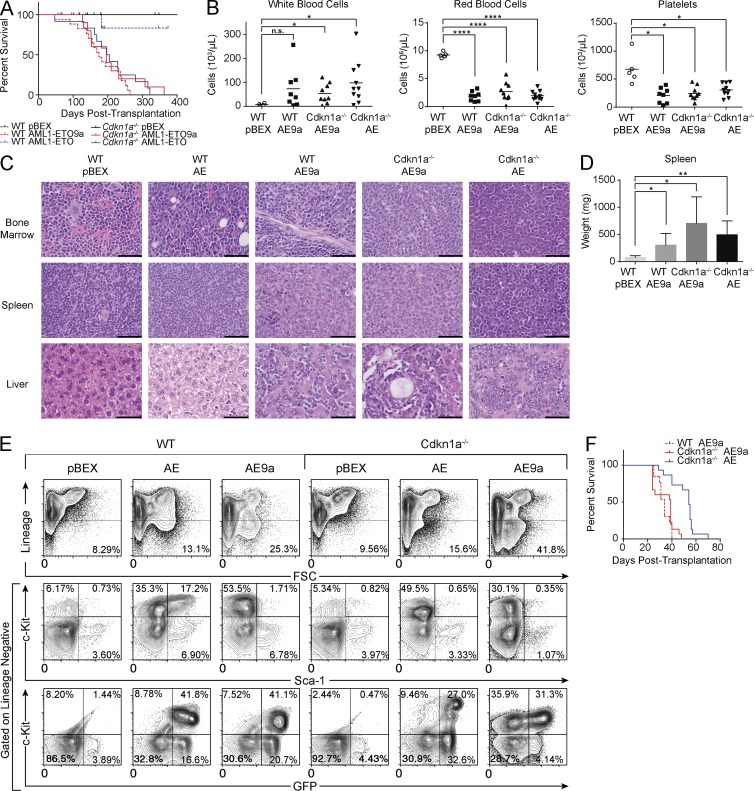
Mouse models of AML1-ETO–driven leukemogenesis are phenotypically similar. (A) Kaplan-Meier plot of mouse survival after transplantation with cells transduced with the given vector. WT pBEX (n = 12); WT AE9a (AML1-ETO9a; n = 17); WT AE (AML1-ETO; n = 17); Cdkn1a−/− pBEX (n = 11); Cdkn1a−/− AE9a (n = 10); Cdkn1a−/− AE (n = 12). (B) Peripheral blood counts of leukemic mice (from left to right, n = 8, n = 9, and n = 10) and controls (n = 5). Horizontal bars represent mean. (C) Representative hematoxylin and eosin staining (n = 3). Bars, 50 µm. (D) At euthanasia, leukemic mice exhibit significant splenomegaly compared with controls. WT pBEX (n = 2); WT AE9a (n = 8); Cdkn1a−/− AE9a (n = 5); Cdkn1a−/− AE (n = 7). Error bars represent the standard deviation from the mean. (B and D) P-values were generated using the Student's t test: *, P < 0.05; **, P < 0.01; ****, P < 0.0001; n.s., not significant. (E) Representative flow cytometry analysis of the bone marrow of transplant recipients (n = 10). (F) Kaplan-Meier plot of mouse survival after transplantation with 2 × 10⁶ leukemic spleen cells. WT AE9a (n = 15); Cdkn1a−/− AE9a (n = 13); Cdkn1a−/− AE (n = 15).

